
Reviewing Agricultural Trade Policies
To Promote Intra-OIC Agricultural Trade
95
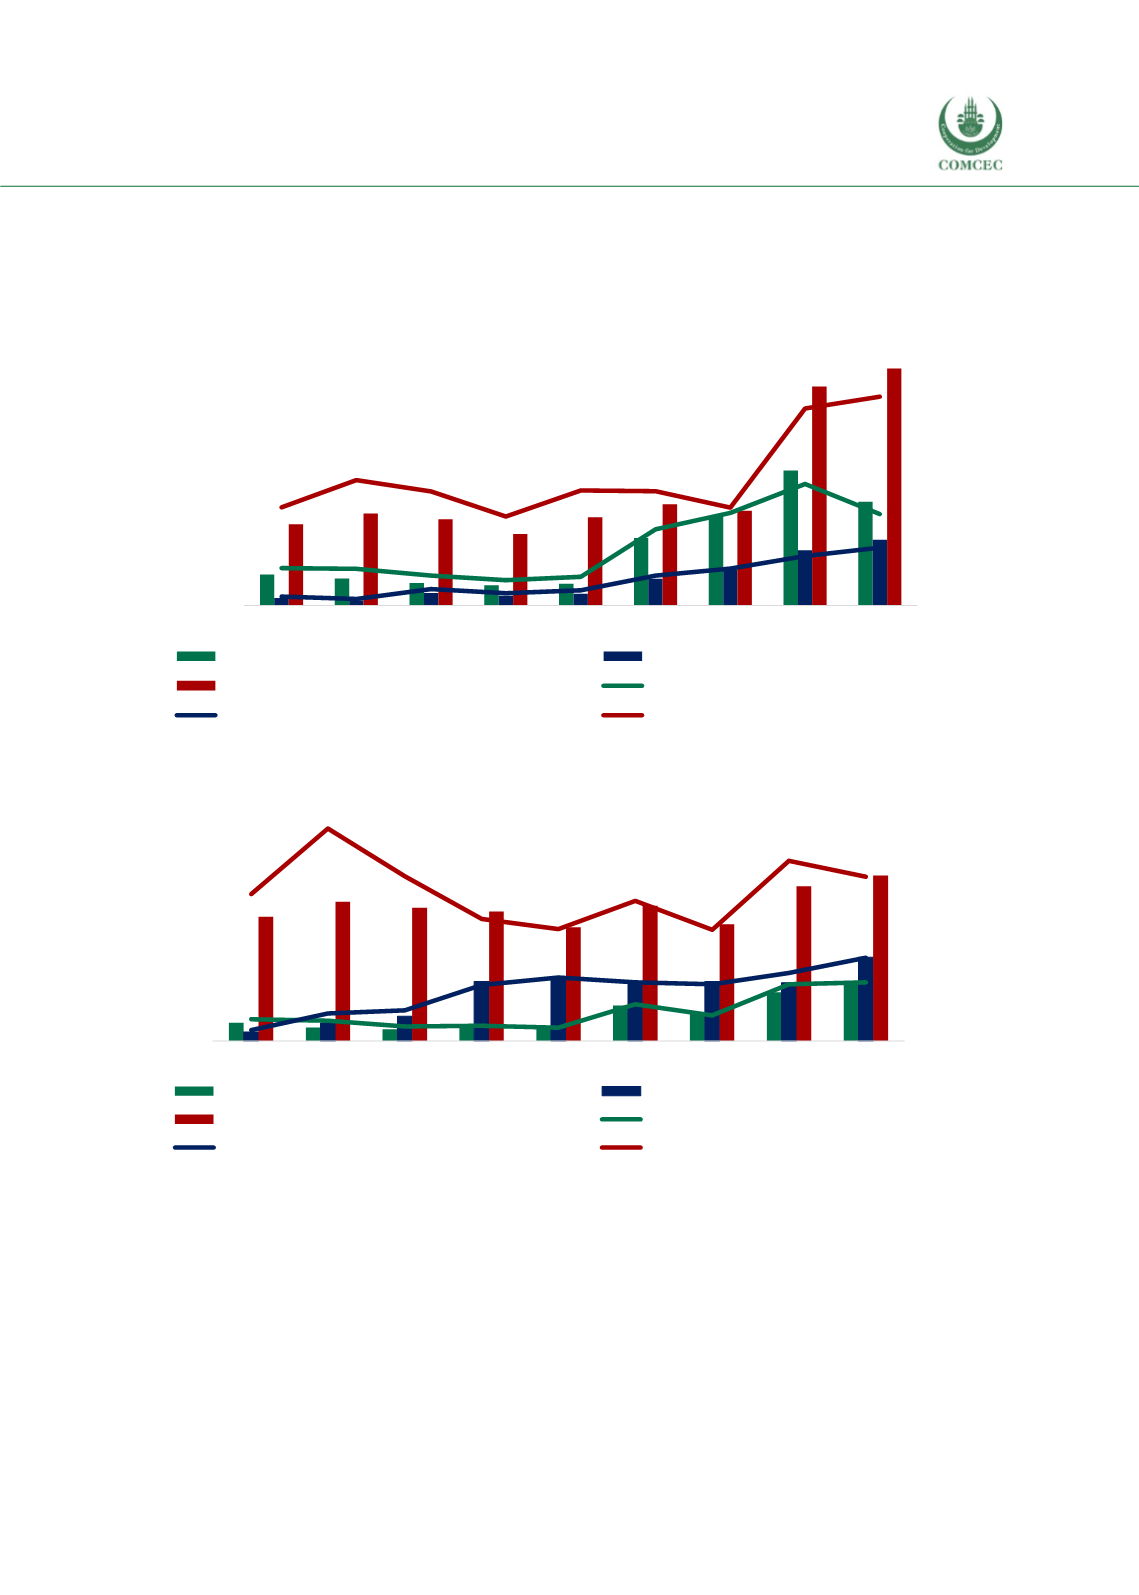
exports followed by African group and Asian group. African group’s share increased from 1.5%
to 3.6% over the period of 2008 and 2016. The share of Morocco’s agricultural exports to the
Asian group has been following a relatively stable trend within the same period, reflecting an
increase from 0.4% to 2.3%.
Figure 4. 17 Share of OIC Groups in Morocco’s Agricultural Exports
Source: CEPII BACI, Eurostat RAMON, UN Comtrade, UN Trade Statistics, and authors’ calculations
Figure 4. 18 Share of OIC Groups in Morocco’s Agricultural Imports
Source: CEPII BACI, Eurostat RAMON, UN Comtrade, UN Trade Statistics, and authors’ calculations
The distribution of Morocco’s agricultural imports according to the three OIC member country
groups is shown in Figure 4.18. The share of Arab group decreased from 4.4% to 3.4% from
2008 to 2014, but recovered with an increase to 5% in 2016. All three groups exhibited
increasing shares and values in Morocco’s agricultural imports over the period of 2008 and
2016. The share of Asian group increased from 0.3% to 2.5%with an increase of 0.1 billion USD
in volume. The African group’s share increased from 0.7% to 1.8%with an increase of 0.1 billion
USD in volume during the same period.
0
50
100
150
200
250
300
350
400
450
500
0
2
4
6
8
10
2008 2009 2010 2011 2012 2013 2014 2015 2016
African Group (million USD)
Asian Group (million USD)
Arab Group (million USD)
African share in total agricultural exp. (%)
Asian share in total agricultural exp. (%)
Arab share in total agricultural exp. (%)
million USD
%
0
50
100
150
200
250
300
350
0
1
2
3
4
5
6
7
2008 2009 2010 2011 2012 2013 2014 2015 2016
African Group (million USD)
Asian Group (million USD)
Arab Group (million USD)
African share in total agricultural imp. (%)
Asian share in total agricultural imp. (%)
Arab share in total agricultural imp. (%)
million USD
%


