


 106 / 213

Reviewing Agricultural Trade Policies
To Promote Intra-OIC Agricultural Trade
94
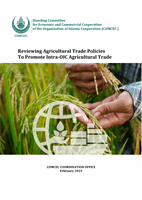
Figure 4. 16 Breakdown of Morocco’s Agricultural Import Origins, 2016
Source: CEPII BACI, Eurostat RAMON, UN Comtrade, UN Trade Statistics, authors’ visualizations
4.2.1. Agricultural Trade with the OIC Countries
General overview
As shown in Table 4.16, OIC member countries are beginning to account for a significant part of
Morocco’s agricultural trade, with their increasing shares in agricultural exports and imports of
Morocco. The value of Morocco’s agricultural exports to the OIC countries increased from 0.2
billion USD in 2008 to 0.8 billion USD in 2016 (300% increase) with a percent share in total
agricultural exports increasing from 5.6% to 14% during the 2008-2016 period. The total value
of Morocco’s agricultural imports from OIC countries is smaller than its exports, demonstrating
a trade surplus. The value of agricultural product imports fromOIC countries increased from 0.2
billion USD to 0.5 billion USD (150% increase) with a percent share in agricultural imports
increasing from 5.4% in 2008 to 9.3% in 2016.
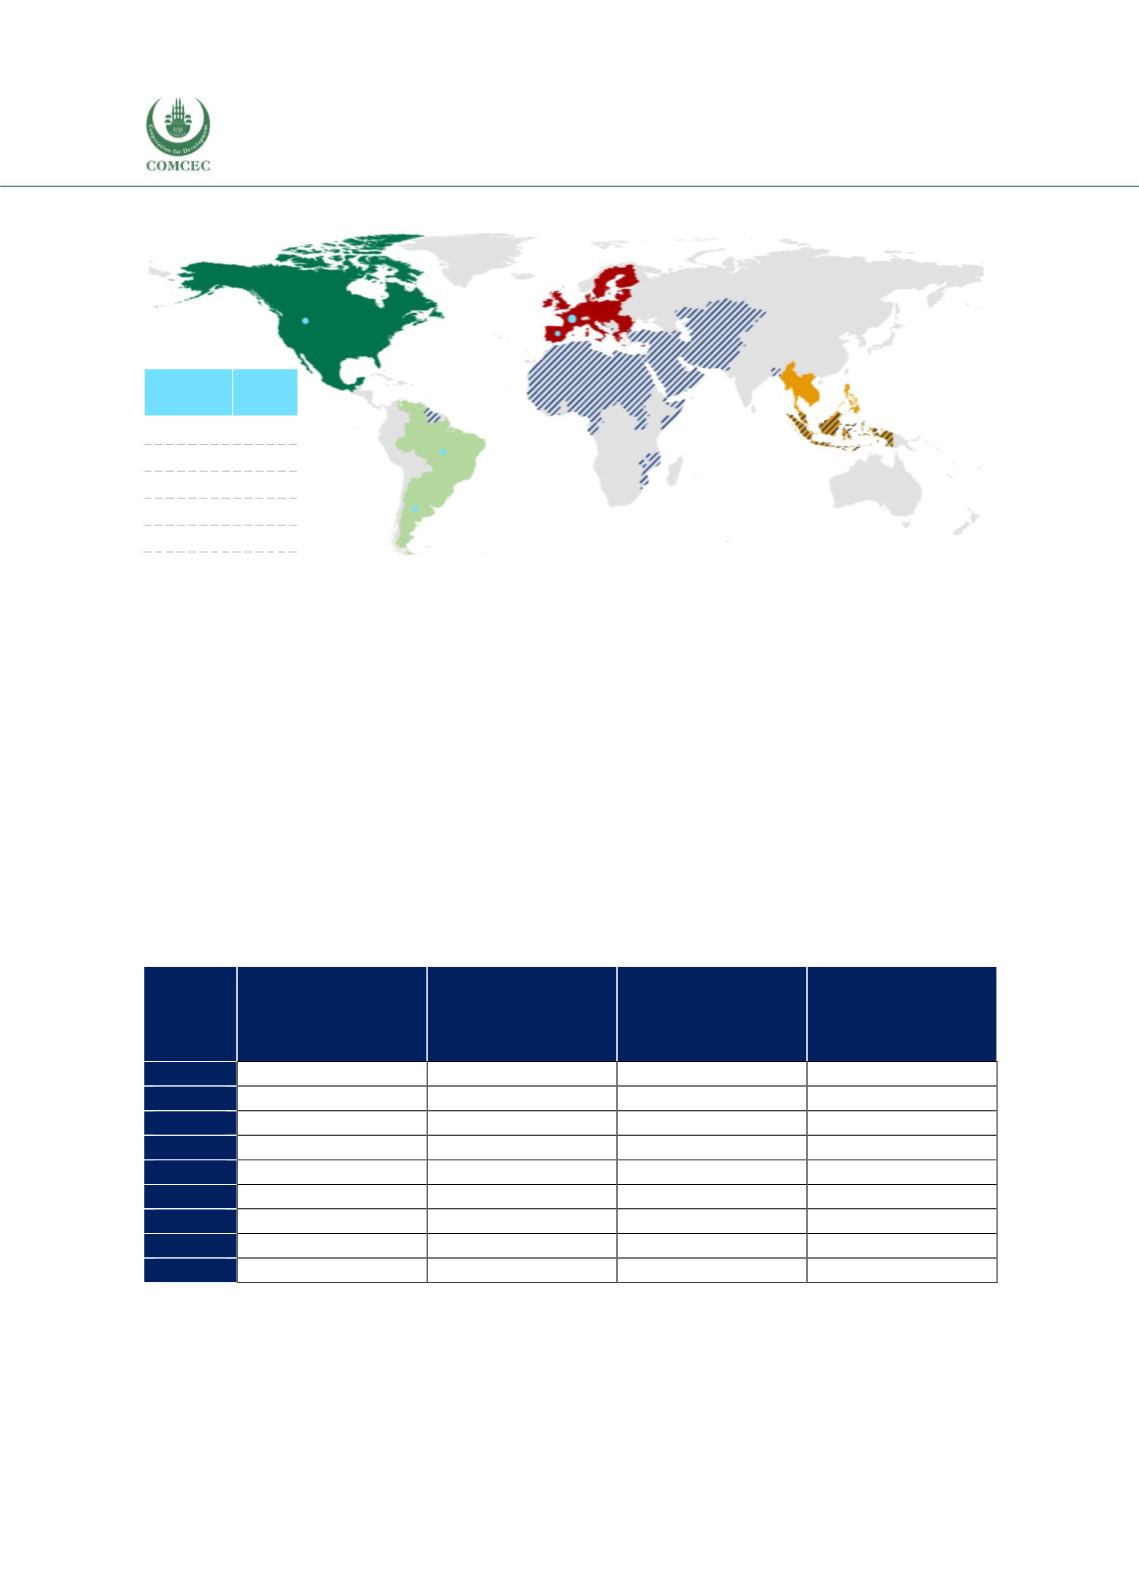
Table 4. 16 Value & Share of OIC in Morocco’s Agricultural Trade
Year
Value (exports)
billion USD
Share in
Morocco’s total
agricultural
exports, %
Value (imports)
billion USD
Share in
Morocco’s total
agricultural
imports, %
2008
0.2
5.6
0.2
5.4
2009
0.2
6.6
0.3
7.9
2010
0.2
6.3
0.3
6.4
2011
0.2
4.9
0.3
5.9
2012
0.2
6.2
0.3
5.7
2013
0.4
8.6
0.3
7.1
2014
0.4
8.9
0.3
5.9
2015
0.8
14.3
0.4
9.2
2016
0.8
14.0
0.5
9.3
Source: CEPII BACI, Eurostat RAMON, UN Comtrade, UN Trade Statistics, and authors’ calculations
The distribution of Morocco’s agricultural exports according to the three OIC member country
groups is shown in Figure 4.17. Exports to Arab group increased from 0.2 billion to USD in 2008
to 0.5 billion USD in 2016, representing a share of 3.8% and 8.1% in total agricultural exports
for 2008 and 2016, respectively. Arab group has the largest share in Morocco’s agricultural
EU-28
%42
NAFTA
%13
MERCOSUR
%17
ASEAN
%2
OIC %9
Top 5
Partner
Share
France
16%
USA
9%
Brazil
8%
Argentina
8%
Spain
7%