
Enhancing Public Availability of Customs Information
In the Islamic Countries
82
regularly provides technical assistance to foreign Customs services, typically from the region,
and has shared its experience through international bodies including COMCEC. This experience
is a good example of how a successful technical assistance project can provide the basis for
information exchange and learning among developing countries.
4.7.
Bangladesh
Introduction
Bangladesh is a Least Developed Country as defined by the United Nations, but one that has been
experiencing rapid economic growth and poverty reduction over recent years. As such, it is
likely to move out of that category in the near future, havingmade great strides forward in terms
of its human and economic development. Since 2010, per capita GNI in purchasing power parity
(PPP) terms has grown at just over 6.5% on an annualized basis. Trade integration has been an
important part of the country’s growth and development strategy, with world markets playing
a dual role both as a source of final demand for output in key sectors, but also as a source of
technology-rich capital goods and intermediate inputs that help boost productivity and
competitiveness.
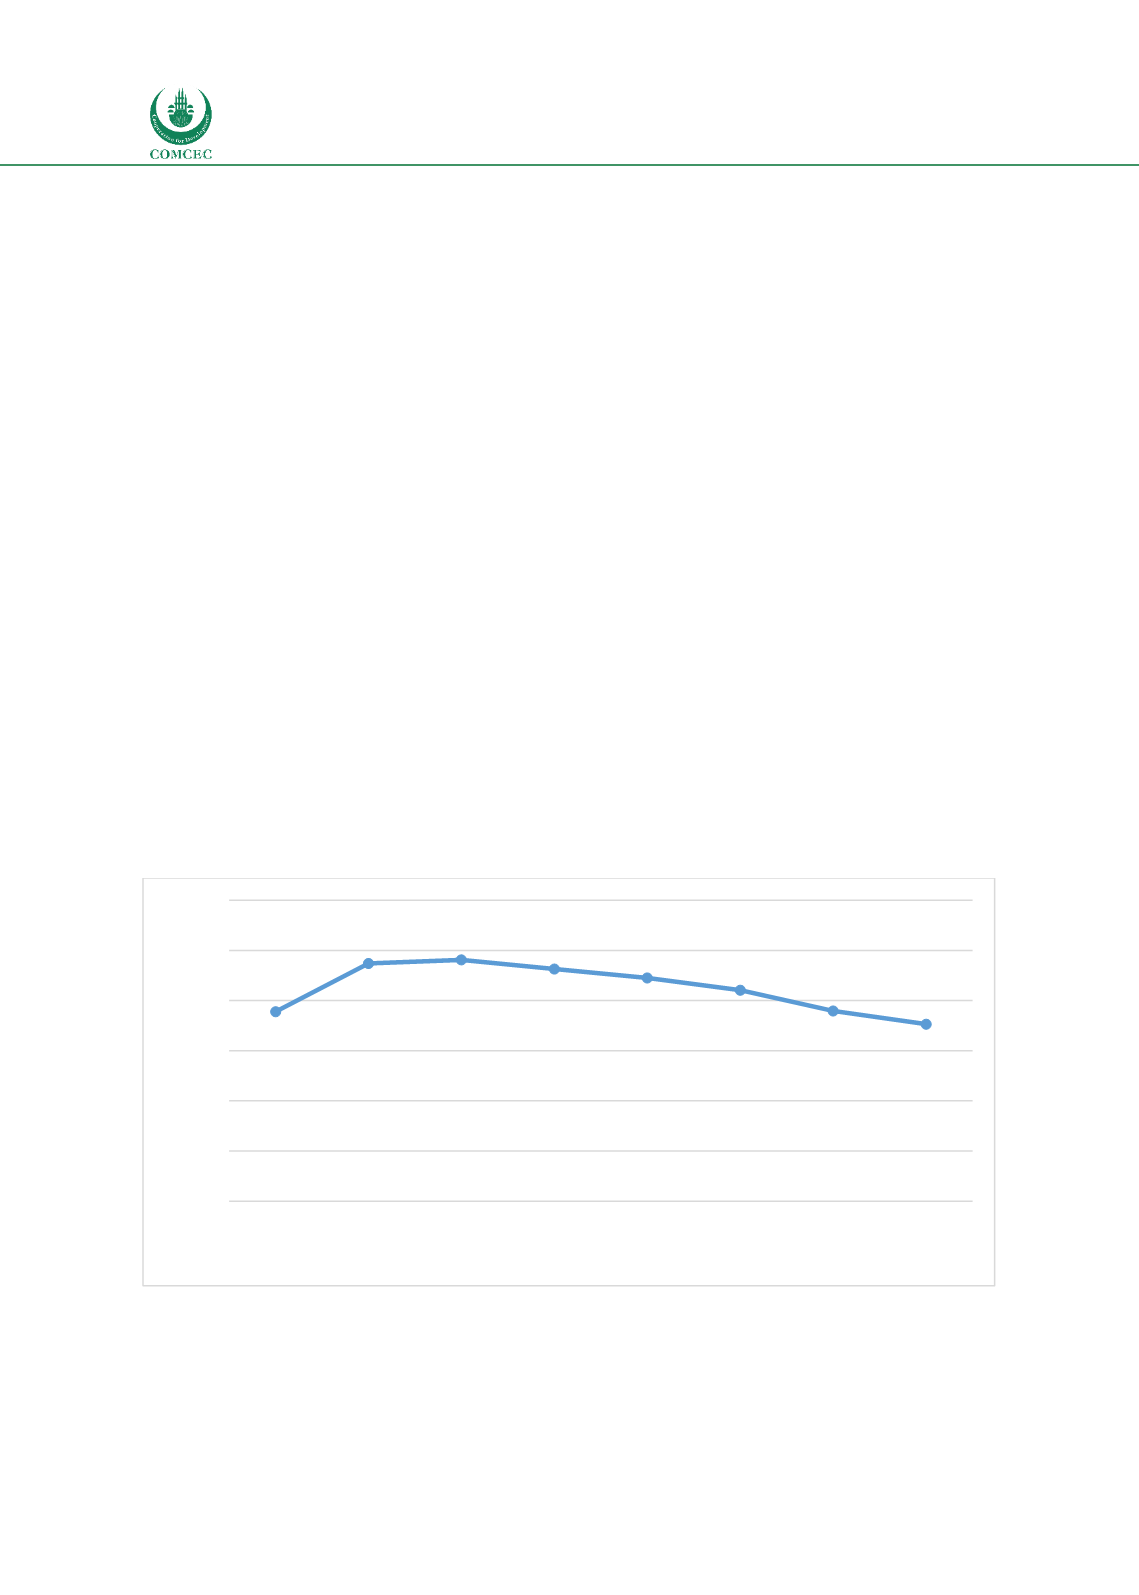
Figure 40 shows the importance of trade to Bangladesh’s economy: there is a sharp increase in
the trade to GDP ratio in the early part of the sample, with level performance through 2012, after
which the figure starts to decline. Although not of the same order of magnitude as countries like
Malaysia, where the figure is frequently over 100% due to intensive trade in intermediates
through GVCs, for a populous country, this ratio is nonetheless substantial. Moreover, its
evolution shows that in the early part of the sample, trade was growing faster than GDP, thus
indicating increasing integration with the world economy. As in many countries around the
world, that process has slowed during recovery from the Global Financial Crisis.
Figure 40: Trade to GDP ratio, Bangladesh, 2010-2017, percent.
Source: World Development Indicators.
0
10
20
30
40
50
60
2010
2011
2012
2013
2014
2015
2016
2017
Percent
Year


