


 79 / 194

Authorized Economic Operator Programs
In the Islamic Countries:
Enhancing Customs-Traders Partnership
69
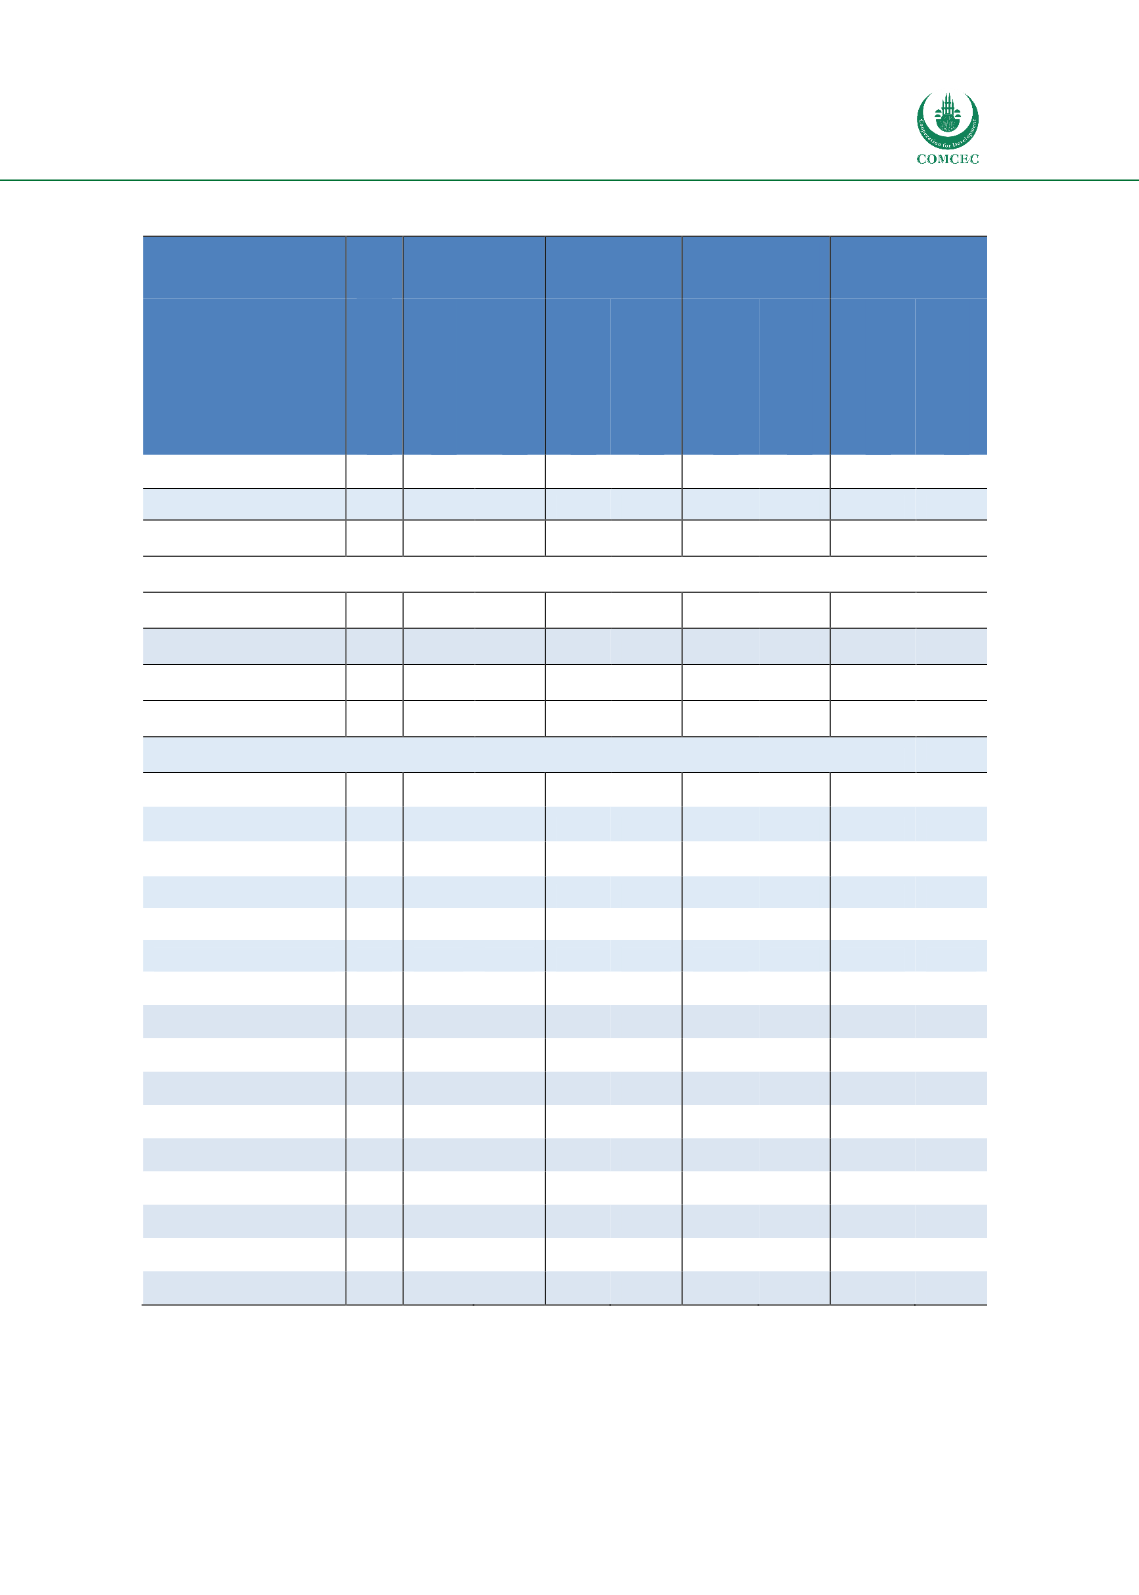
Table 3.16. Comparison of Trade Costs among countries with and without AEO
Cost to
export
Cost to
import
Time to
export
Time to
import
Efficiency
Border
Documentary
Border
Documentary
Border
Documentary
Border
Documentary
World
4.1
399
142
465
167
59
58
79
69
Best Practice Countries
Canada
5.0
167
156
172
163
2
1
2
1
Japan
5.0
265
54
299
107
23
2
40
3
The EU
4.9
85
17
29
4
8
1
2
1
OIC Region
AEO
4.2
277
118
431
226
50
46
104
81
Azerbaijan
3.8
214
300
300
200
29
33
30
38
Brunei Darussalam
4.0
340
90
395
50
117
159
48
136
Egypt, Arab Rep.
3.9
258
100
554 1000
48
88
240
265
Indonesia
4.1
254
154
383
164
53
61
99
126
Jordan
4.7
131
16
181
30
38
6
79
55
Malaysia
5.2
321
45
321
60
47
10
71
10
Morocco
4.4
156
107
228
116
19
26
106
26
Oman
4.5
233
107
374
124
52
15
70
15
Saudi Arabia
4.6
338
105
779
390
69
86
228
127
Tunisia
3.1
469
200
596
144
50
3
80
27
Turkey
3.9
376
87
655
142
16
5
41
11
Uganda
4.1
229
102
412
296
68
58
154
138
CCP
3.5
660
265
670
358
110
98
126
116
No AEO
2.0
476
212
597
273
69
81
98
98
Source: Authors’ own calculation from World Development Indicators of the World Bank. All the indicators are
the average between 2016-2017. Time represents hours whereas cost represents $.