
Facilitating Trade:
Improving Customs Risk Management Systems
In the OIC Member States
200
Any other party you might collaborate with regarding risk management - please
write the details below
13
2.53
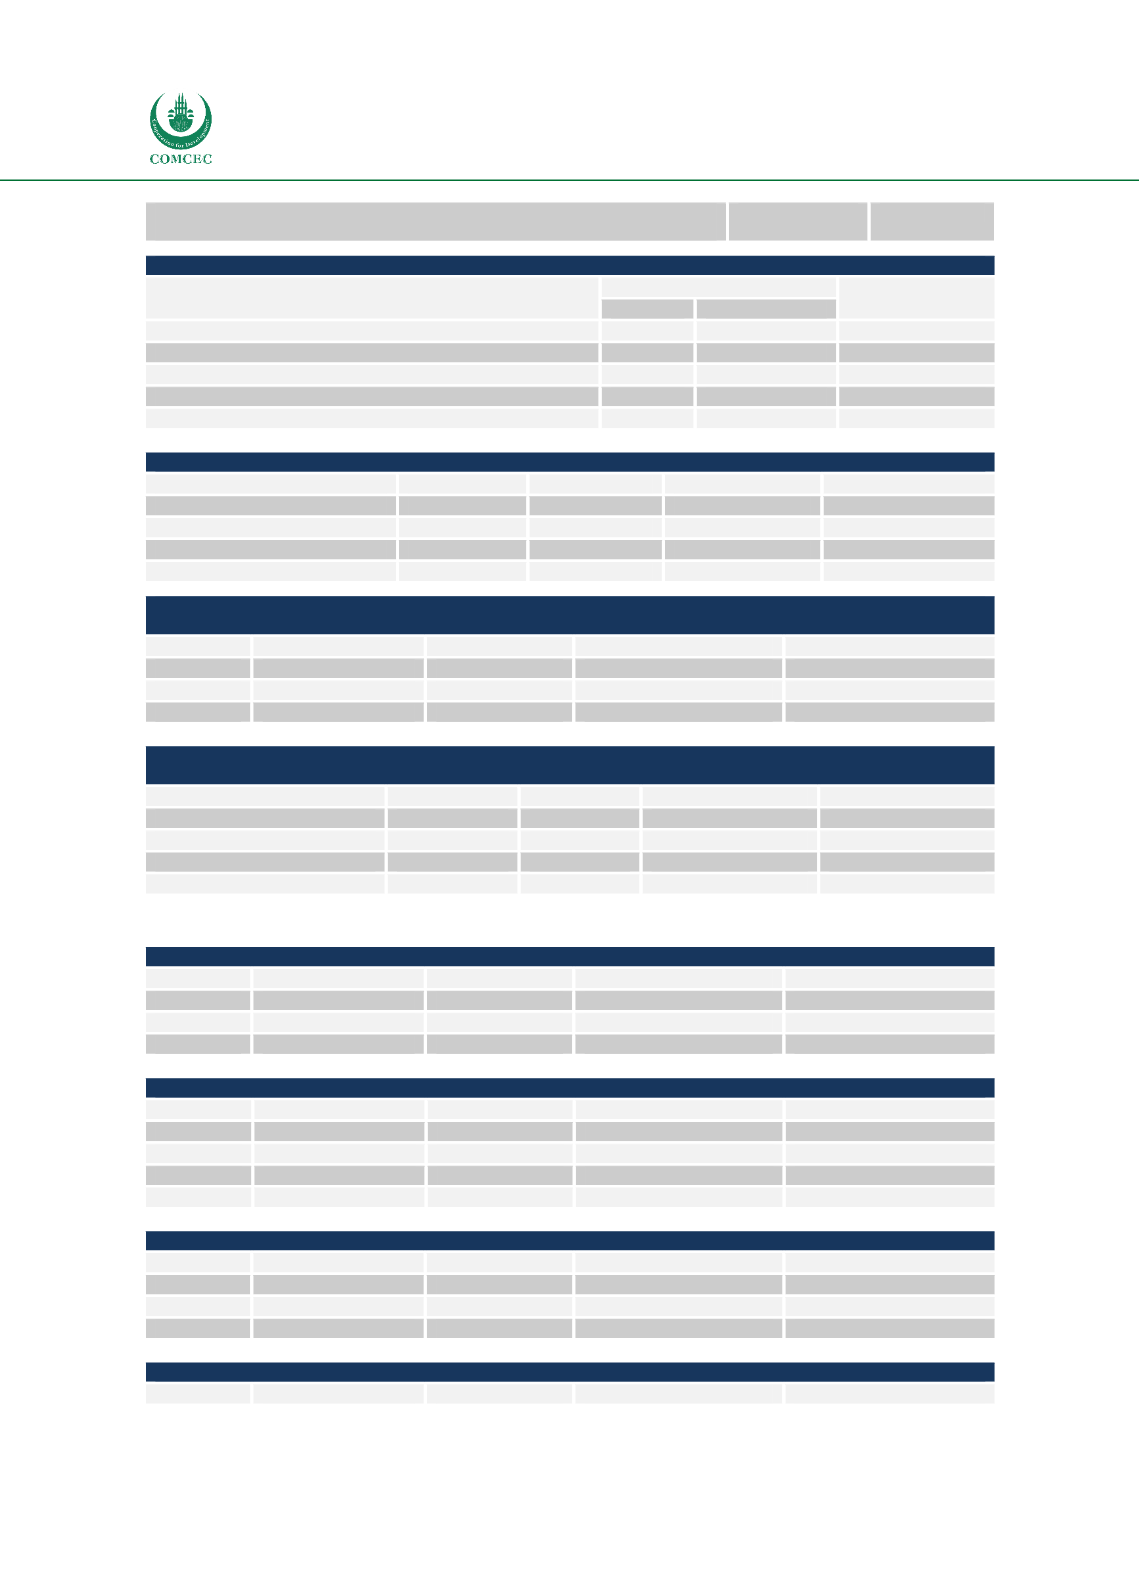
26. Does your Customs Service have authority to exchange risk indicators / information / intelligence with:
Responses
Percent of Cases
N
Percent
National Law Enforcement Agencies
12
26.7%
75.0%
International Law Enforcement Agencies
11
24.4%
68.7%
Other Customs Services
13
28.9%
81.2%
Key Regional/International Organizations
9
20.0%
56.2%
45
100.0%
27. Does your administration have access to the WCOs Central Enforcement Network (CEN) application?
Frequency
Percent
Valid Percent
Cumulative Percent
No
1
6.3
6.3
6.3
Not yet, but planned
1
6.3
6.3
12.6
Yes
14
87.4
87.4
100.0
Total
16
100.0
100.0
28. Has your administration designated a WCOs National Contact Point of Regional Intelligence Liaison Offices (RILO) –
Central Enforcement Network?
Frequency
Percent
Valid Percent
Cumulative Percent
No
2
12.5
12.5
12.5
Yes
14
87.5
85.7
100.0
Total
16
100.0
100.0
29. Does your administration use the WCOs nCEN application to collect and store law-enforcement information (including
seizures and offences and suspected persons or business entities) at the national level?
Frequency
Percent
Valid Percent
Cumulative Percent
No
2
12.5
12.5
12.5
Not yet, but planned
1
6.3
6.3
18.8
Yes
13
81.2
81.2
100.0
Total
16
100.0
100.0
7.2.2.5
CRM Monitoring, review and Operational Aspects
30. Is the trade related data and information accurate for performing reporting and analysis services?
Frequency
Percent
Valid Percent
Cumulative Percent
No
4
25.0
25.0
25.0
Yes
12
75.0
75.0
100.0
Total
16
100.0
100.0
31. Did the Customs administration implement data mining tools for targeting purposes?
Frequency
Percent
Valid Percent
Cumulative Percent
No
3
18.7
18.7
18.7
Planned
5
31.3
31.3
50.0
Yes
8
50.0
50.0
100.0
Total
16
100.0
100.0
32. Are your officers are authorized to use intuition for targeting and selective?
Frequency
Percent
Valid Percent
Cumulative Percent
No
2
12.5
12.5
12.5
Yes
14
87.5
87.5
100.0
Total
16
100.0
100.0
33. Do you have specific examination notes that are made available to inspection officers
Frequency
Percent
Valid Percent
Cumulative Percent


