
Special Economic Zones in the OIC Region:
Learning from Experience
36
4.1.2
SEZ Typologies
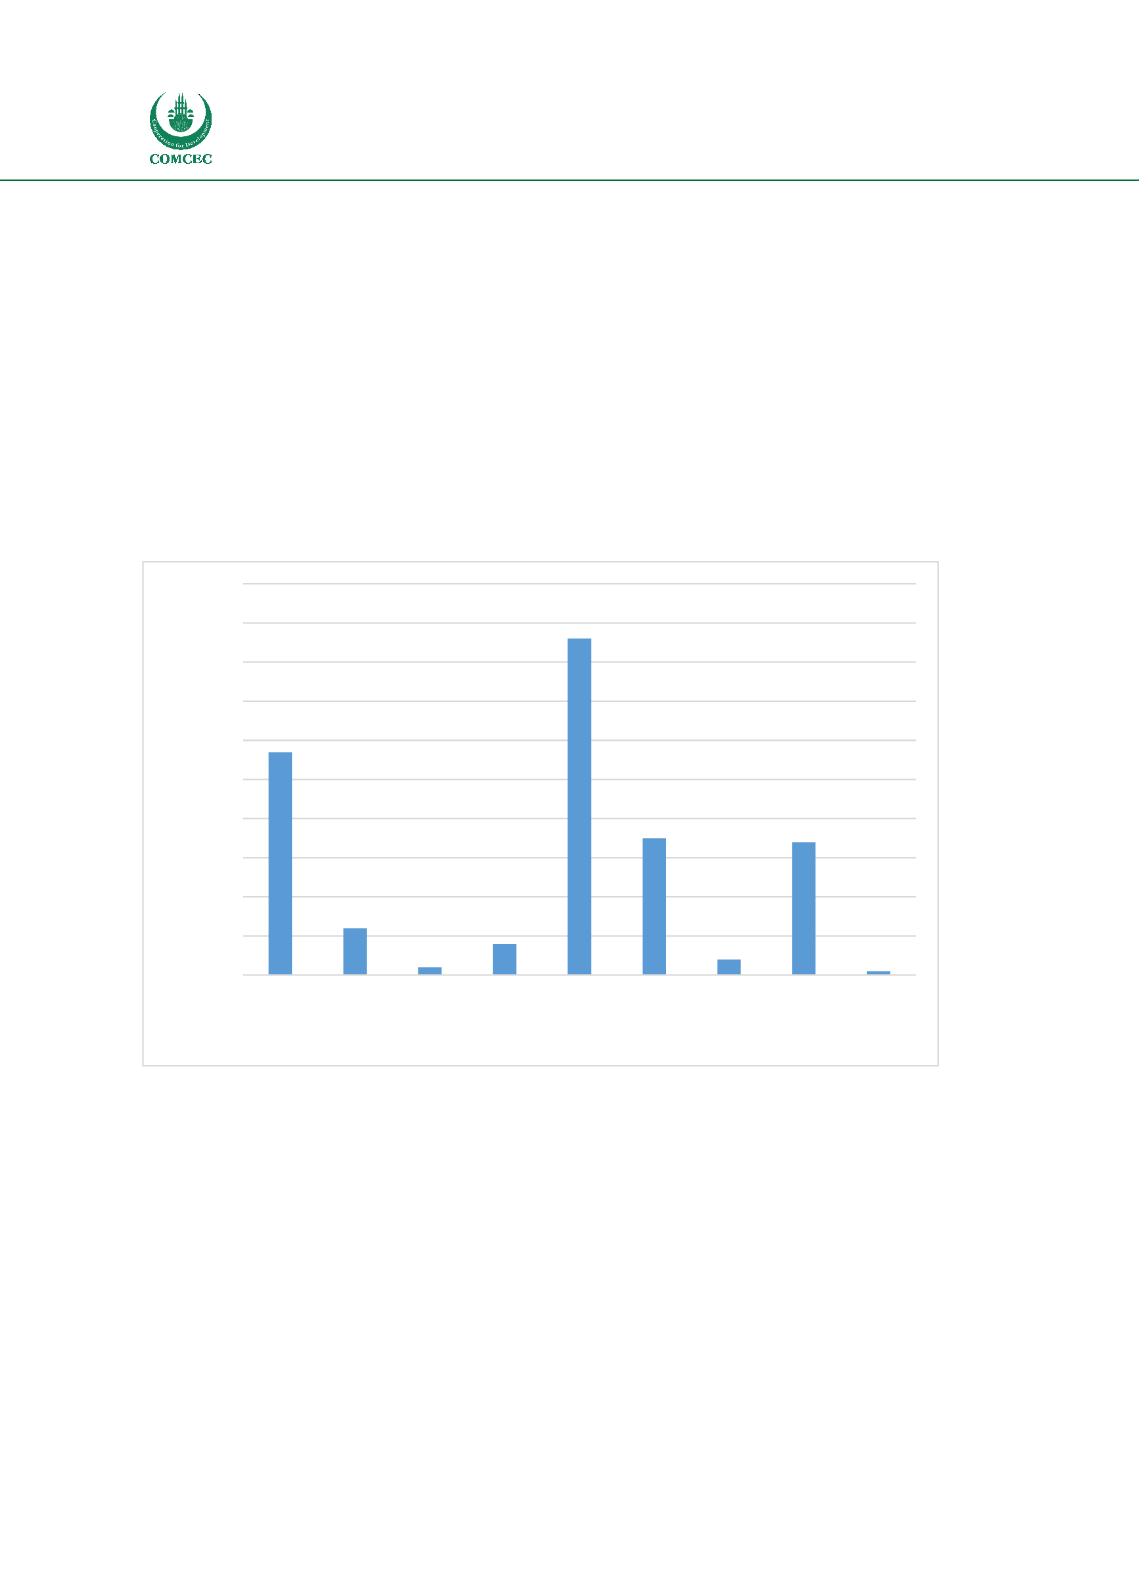
Comparative analysis has also been undertaken with regard to SEZ typology. The most common
typology recorded within OIC Member Countries, as shown i
n Figure 2,are FTZs, following by
EPZs, Hybrid EPZs and SEZs.
Drawing on the analysis fro
m Figure 3 it can be seen that there is a clear focus on FTZs within
the United Arab Emirates and Turkey whilst the distribution of EPZs is more even across the OIC
Member Countries. Iran in particular has undergone a significant programme of SEZ
development within recent years accounting for just under half of all SEZs recorded within OIC
Member Countries.
Figure 2 – Total SEZs by Typology within OIC Member Countries
Source: BuroHappold Analysis 2017
Figure 3 indicates that across the OIC Member Countries, approximately 36% of SEZs are FTZs,
whilst approximately 25% are classified as EPZs. Hybrid EPZs and SEZs also account for
approximately 15% and 14% of zones within OIC Member Countries respectively.
0
10
20
30
40
50
60
70
80
90
100
EPZ
EZ Financial
Services
Zone
Freeport FTZ Hybrid
EPZ
IT /
Science
Park
SEZ Tourism
Zone
Total Number


