


 72 / 111

59
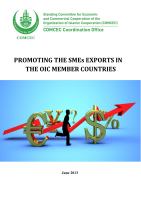
Manufacturing contributed 24.3% of GDP in 2011 and engaged an estimated 13.3% of the employed
labour force. Table 10 below shows a breakdown by industry of the main sectors of the Indonesian
economy.
Table 3.9: Share of Main Sectors in GDP, 2007-11
Indonesia
2007
2008
2009
2010
2011
Agriculture
13.7
14.5
15.3
15.3
14.7
Mining and quarrying
11.2
10.9
10.6
11.2
11.9
Manufacturing
27
27.8
26.3
24.8
24.3
Electricity, gas and
water
0.9
0.8
0.8
0.8
0.8
Construction
7.7
8.5
9.9
10.3
10.2
Services
39.5
37.5
37.1
37.6
38.1
Source: WTO
In 2011, fuels accounted for 33.9% of exports, up from 25.6% in 2007. The bulk of Indonesia’s remaining
exports consist of primary and semi-processed agricultural and mineral commodities. The most important
of these have traditionally been rubber, coffee, tin, shrimps and palm oil. Indonesia is currently the largest
producer and exporter of palm oil, having about half of the global export market. The overall value of
exports of goods in 2012 came to 188.1 billion US dollars (fob), down 6.3% from the previous year,
mainly due to the decrease in exports of manufactured products and mining products as a result of
weakening world demand and the decline in export prices. In non-oil and gas exports, the decline in
export performance of manufactured products and mining products took place between mid-2011 until
mid-2012. Declining demand in the traditional international market place of Europe has contributed to the
slowing down of the growth of exports in the manufacturing sector especially in manufactured rubber,
chemical, base metal, electrical, and textile and textile products. However, exports of crude palm oil
(CPO) were still registering a positive growth that helped to sustain exports of manufacturing products
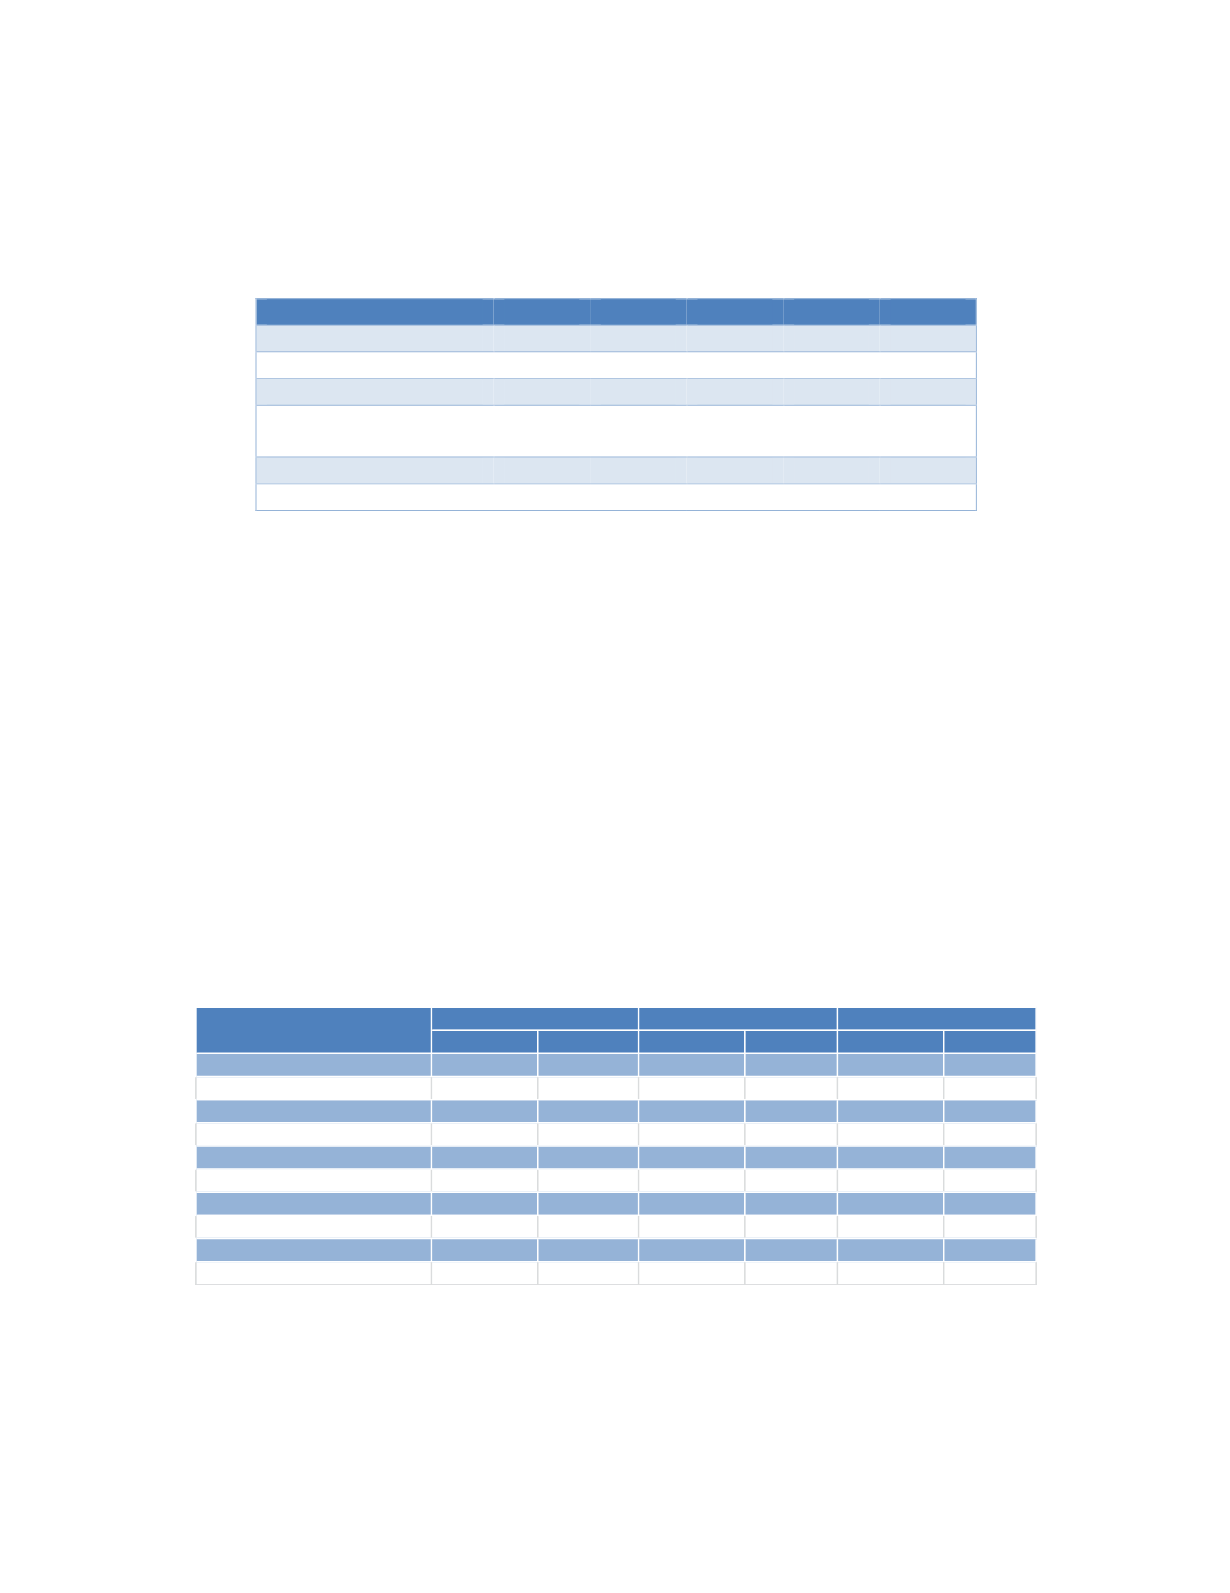
and record positive growth. Table 11 below shows the trends in growth or decline of non-oil and gas
exports.
Table 3.10: Non-Oil and Gas Export by Commodities (Real Value)
Source: BPS-Statistics Indonesia
Growth (%) Share (%) Growth (%) Share (%) Growth (%) Share (%)
Coal
5.5
9.7
12.6
10.7
7.6
11.3
Palm Oil
-12.1
5.3
-1.7
4.5
16.8
5.2
Textile and Textile products
3.6
16.2
9.6
15.8
-3.4
15
Electrical apparatus
-7.8
7.7
-9.4
5.8
-0.8
5.7
Chemical product
6.6
3.2
22
2.2
-18
1.8
Rubber
2.1
2.3
28.3
6.3
-24.6
4.7
Paper
10.1
2.7
-10.3
1.8
-9.5
1.6
Copper
-17
2.4
-33.5
2.4
-45.1
1.3
Other
7.9
50.5
20.3
50.5
70
53.4
Total
3.5
100
12.1
100
1.3
100
2007
2001
2012
Commodity