
Reducing Postharvest Losses
In the OIC Member Countries
48
According to UNDP/MOA (1993) quoted in an FAO report (2003a), losses of up to 20–35%
have been reported in Ethiopia for milk and dairy products between milking and consumption.
It is argued that due to the highly perishable nature of milk and mishandling practices the
amount produced is subjected to high postharvest losses. Direct spoilage losses of 2% to 5%
due to improper milking equipment have been reported in Ethiopia. Also, the amount of milk
available for human consumption (by household or through marketing of products) is affected
by the use of milk replacer as calf feed. The study estimates that about 17.5% to 30% of milk is
left for the calf which otherwise could have been used for human consumption if complete
milking was practiced.
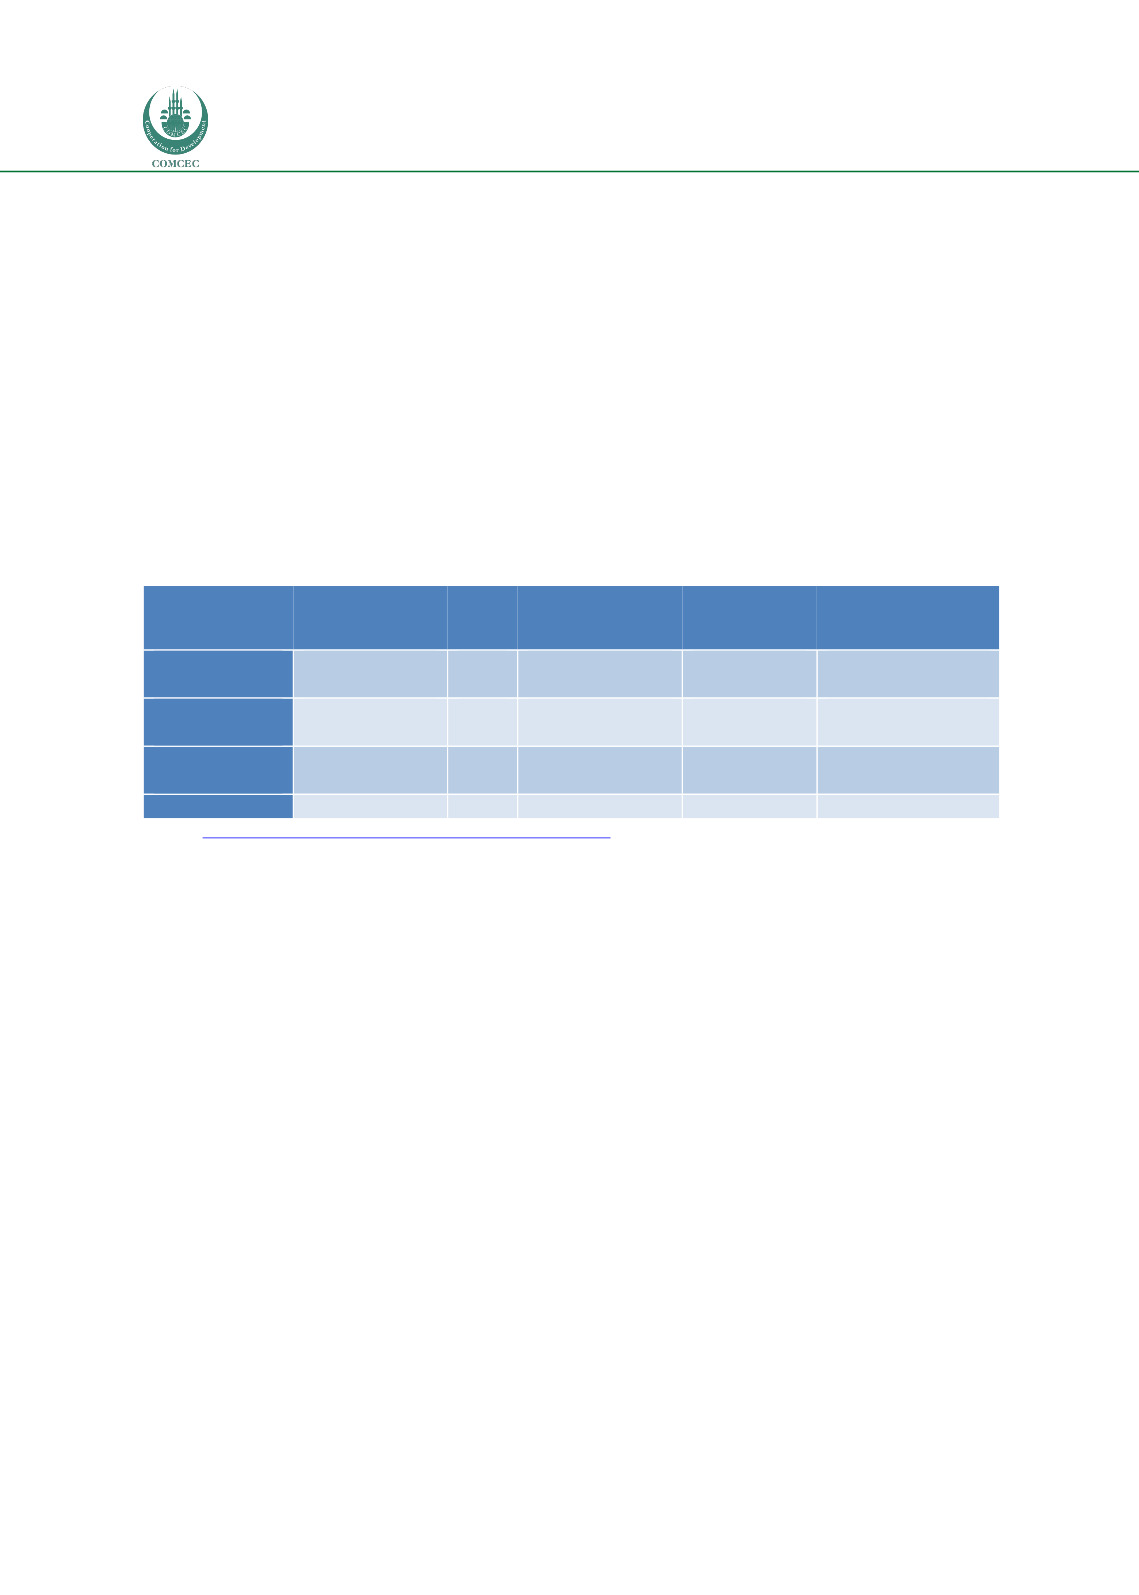
Table provides an estimate of the value of milk and dairy products lost in the dairy value chains
of OIC countries and the values of these losses. The data show that total production of the three
main dairy products was 124 million tonnes in 2012 in the OIC Member Countries. Assuming
16% losses the quantitative losses amount to 19.8 million tonnes worth about US$ billion 8.9.
Table 14: Estimated monetary value of annual quantitative PHL in dairy value chains in OIC
countries (in current US$)
1
Commodity
Annual
production
(tonnes)
PHL
(%)
Quantitative PHL
(tonnes)
Unit Value
(US$/ tonne)
Value of Annual
Losses (billion
US$)
Dairy OIC,
1
st
Product
95,098,932
16%
15,215,829
437
6.649
Dairy OIC
2
nd
Product
24,447,803
16%
3,911,648
411
1.608
Dairy OIC
3
rd
Product
4,471,017
16%
715,363
950
0.680
Total
124,017,752
19,842,840
8.937
Source
: http://FAOSTAT.fao.org/site/569/default.aspx#ancorNB. The values have been calculated using information available for the countries and products available
(FAOSTAT 2012). While gross value data was available for 30 countries in the case of the 1
st
dairy product
produced in OIC countries (i.e. mainly fresh cow milk), only 13 and 10 countries had values indicated for 2
nd
and 3
rd
dairy products respectively (e.g. goat or sheep milk). Interestingly, the unit values indicated for the 3
rd
product were quite high although quantities and overall values were low. As for postharvest losses (i.e. 16%),
the same value was taken as indicated in the aforementioned framework paper on Postharvest Loss Reduction
in Africa, FAO and AfDB 2009.
Causes and consequences of the postharvest losses in the milk and dairy value chain
The causes and consequences of postharvest losses in the milk and dairy value chains of the
countries studied appear well understood (e.g. results of survey in OIC countries presented in
Annex 3). Losses in the dairy sector lead to reduced quantities of food available for human
consumption. Products the quality of which has been affected between production and
consumption may pose a health risk for consumers. Table 15 provides an overview of the
causes of losses at different stages of the value chain, namely:
Pre-harvest (only covering the main elements)
Milking
Processing
Marketing
Consumption.


