


 60 / 194

Reducing Postharvest Losses
In the OIC Member Countries
46
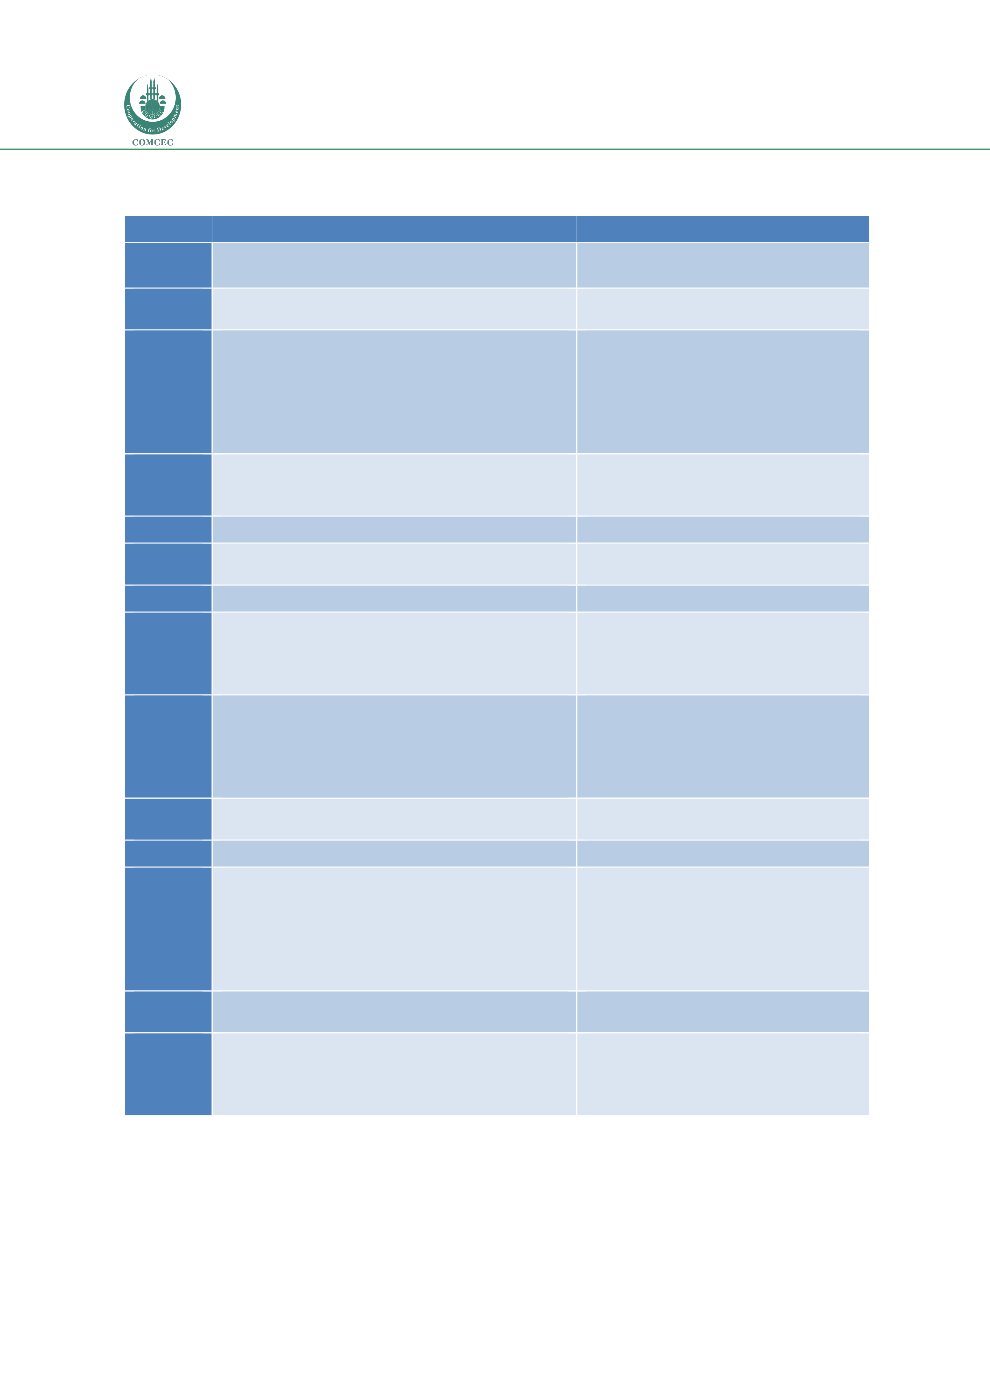
Table 12: Overview of loss assessments in the milk and dairy value chains in selected
countries.
Country
Extent of losses
Sources
Global
18%; Share of milk lost or wasted, 2009
(percent of kcal)
Lipinski
et al, 2013;
World
Resources Institute
Africa
16%; Indicative minimum quantitative
postharvest losses
FAO and AfDB, 2009
Egypt
Description of qualitative losses in dairy value
chain; e.g. “Lacking cold chains and
refrigerated transport systems, combined
with poor knowledge on hygienic handling of
raw milk from farm to factory, lead to high
milk spoilage rates.”
Egypt
case
study;
COMCEC
Coordination Office, 2015
Ethiopia
Losses of up to 20 – 35% have been reported
in Ethiopia for milk and dairy products
between milking and consumption.
FAO (2003a)
1.5% of total value of milk produced
ILRI, 2005
Kenya
7%; percentage of marketed milk
http://www.fao.org/ag/ags/postharvest-management/milk-dairy/
3% of total value of milk produced
ILRI, 2005
Pakista
n
Milk worth Pakistani Rupees 169 billion lost
per annum post-production, corresponding to
19.4% of value of first two dairy products
quoted in FAOSTAT 2012.
Newspaper and online articles in
August 2012:The Express Tribune
5/8
/2012.www.pakistantoday.com.
pk
Syria
Postharvest milk losses in the small-scale
dairy sector are in the range of 10% to 15% in
summer, and 2% to 5% in other seasons;
losses of the public sector do not exceed 1%
in summer.
FAO (2003b)
Tanzani
a
21.9% of marketed milk
http://www.fao.org/ag/ags/postharvest-management/milk-dairy/
5.6% of total value of milk produced
ILRI, 2005
Turkey
The bulk of the milk losses occur at the
production level (10%), followed by
postharvest handling and storage (1%),
processing and packaging (1.5%), distribution
(6%), and consumption at household level
(1.5%). Total losses are 20%.
FAO (2013b)
Uganda
21% of marketed milk; or
http://www.fao.org/ag/ags/postharvest-management/milk-dairy/
27% of all milk produced is lost, i.e. 6% is
wasted at the farm level, whilst 11% and 10%
of production is either lost due to spillage or
spoilage during transport or marketing.
(FAO and AfDB, 2009)
A framework paper on postharvest loss reduction in Africa (FAO and AfDB, 2009) estimates
that the minimum quantitative postharvest losses in the milk and dairy value chain are 16%,
which, in turn, would mean 5.629 million tonnes of milk lost, representing annual losses of the
order of US$ 2.54 billion.