


 33 / 194

Reducing Postharvest Losses
In the OIC Member Countries
19
based in each country. The data for each crop can be looked at by year and down to the
provincial level in each country.
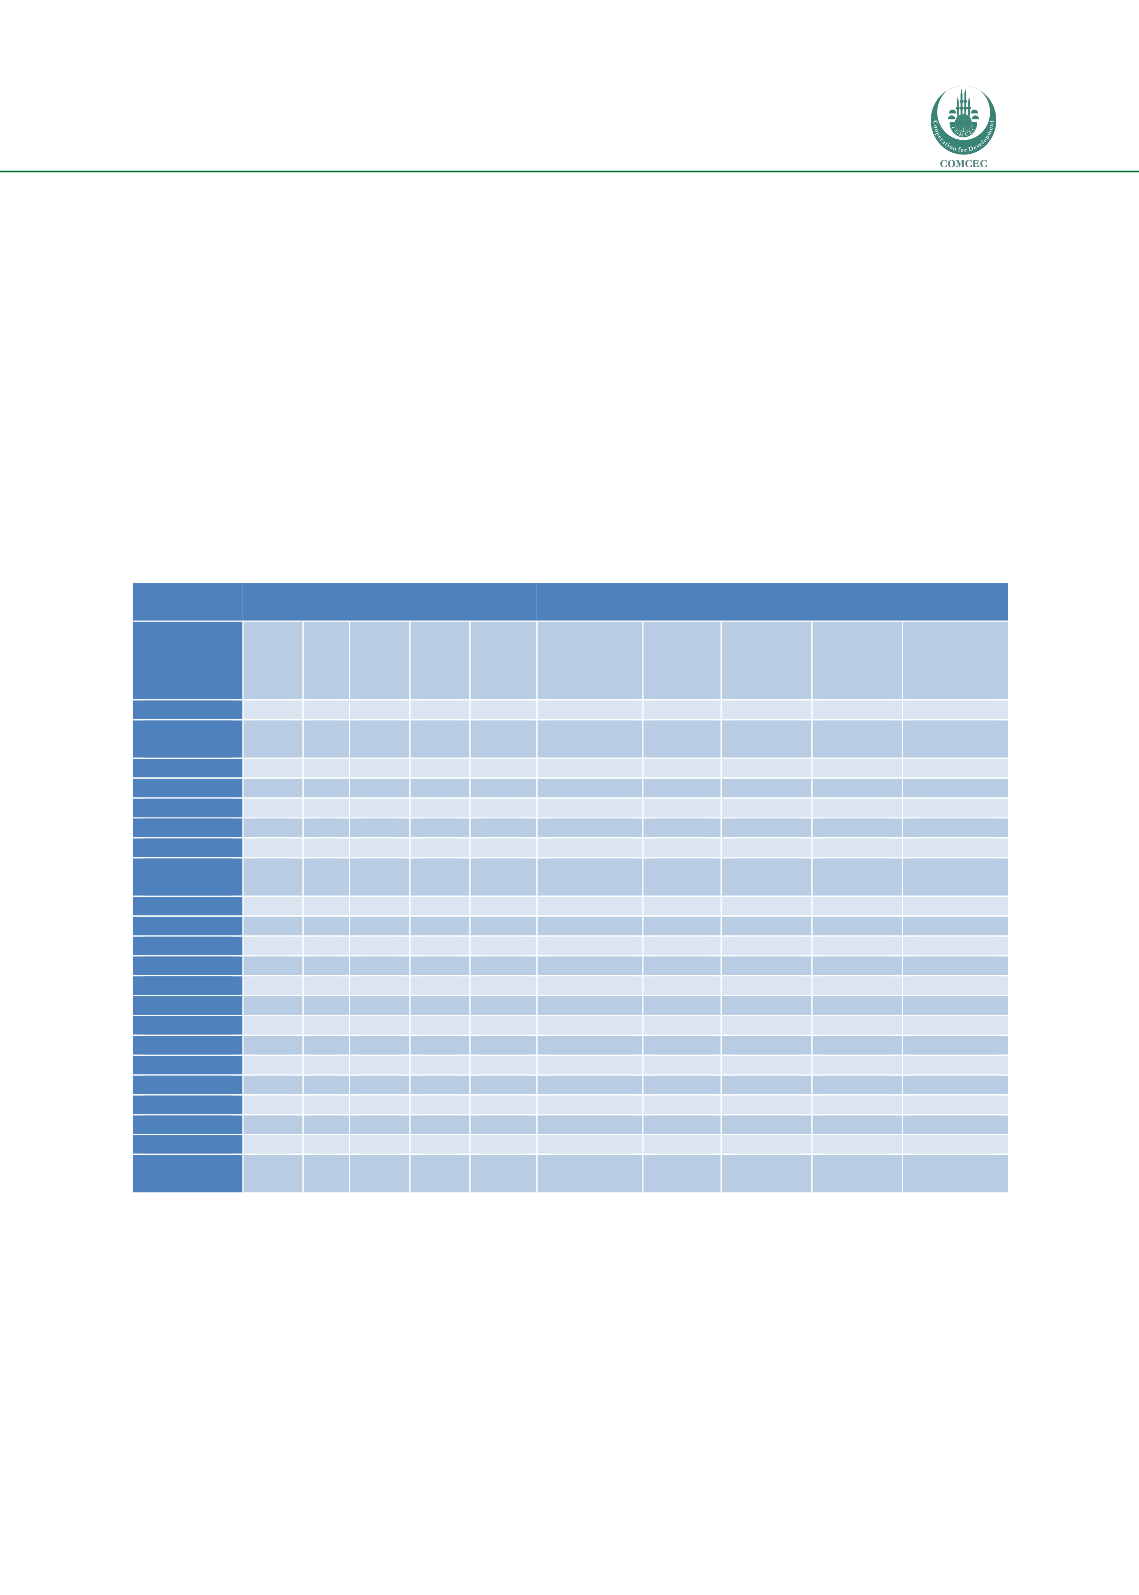
Data extracted from APHLIS has been used to summarise cereal postharvest loss levels and
quantities for 19 of the African Member Countries of the OIC in
Table.In these 19 African OIC
Member Countries alone, postharvest losses of 6,655,727 tonnes of five cereal grains occurred
in 2012. This is food that could have been used to feed citizens and drive economic activity, it
is a waste of the valuable resources (land, water, labour and inputs) used to produce it. The
‘Missing Food’ study estimated that 13.5% of the grain produced across sub-Saharan Africa is
then lost postharvest, this is equivalent to US$4 billion per year or the annual caloric
requirement of 48 million people (World Bank, NRI, FAO, 2011). Climatic changes (CC) in
temperature, rainfall, humidity, extreme events plus natural and human responses to CC and
variability will affect postharvest systems and are likely to increase PHL unless changes are
made (Stathers et al., 2013).
Table 2: APHLIS data on postharvest losses for focal African OIC Member Countries
Country
% postharvest loss - estimates of %
cumulative weight loss (a)
Quantity (tonnes) of annual postharvest loss
Maize
Rice
Wheat
Sorghum
Millet
Maize
Rice
Wheat
Sorghum
Millet
Benin
25
24
24
14
-
235,516
26,794
26,794
23,034
-
Burkina
Faso
18
14
14
12
10
273,550
44,553
44,553
230,687
111,057
Cameroon
22
11**
12**
350,779
17,153**
6,229**
Chad
17
12
12
12
9.
52,279
20,381
20,381
79,754
30,070
Côte d'Ivoire
18***
12***
12***
11***
95,700***
72,236***
4,265***
4,233***
Gambia
18***
12*
12*
12*
11*
3,550***
4,680*
4,680*
2,435*
5,019*
Guinea
16
11
11
11
102,559
220,837
220,837
28,099
Guinea-
Bissau
18
12
12
12
11
1,475
23,653
23,653
2,983
1,947
Mali
18
11
11
12
8
241,910
105,870
100,809
138,512
138,180
Mauritania
17
11
11
12
9
1,395
20,324
20,324
3,268
155
Mozambique
19
12***
13***
11***
296,199
23,170***
43,897***
4,879***
Niger
17
11
11
12
9
1,496
10,080
10,080
167,922
332,889
Nigeria
18
12
12
12
10****
131,815
43,575
43,575
183,788
187,579****
Senegal
20
14
14
13
14
24,648
60,542
60,542
11,512
69,531
Sierra Leone
24
21
21
13,401
295,530
295,530
Somalia
24
11
11
12
11,952
153
153
10,580
South Sudan
17
10,054
Sudan
12***
9***
84,736***
1,512***
Togo
31
23
23
23
11
253,718
37,496
37,496
57,330
2,889
Uganda
20
15
15
13
13*
507,541
30,497
27,617
47,095
35,576*
Mean % PHL
20
14
14
13
10.3
Annual PHL
(t)
2,609,537
944,965
1,049,583
1,126,126
925,516
Notes:
Data from the year 2012, with the exception of cells marked ****= 2006, ***= 2007, **= 2010, *= 2011
“-“ = no data
(a) Losses incurred during harvesting, drying, handling operations, farm storage, transport and market storage
Source: APHLIS, 201
6 www.aphlis.net