


 31 / 194

Reducing Postharvest Losses
In the OIC Member Countries
17
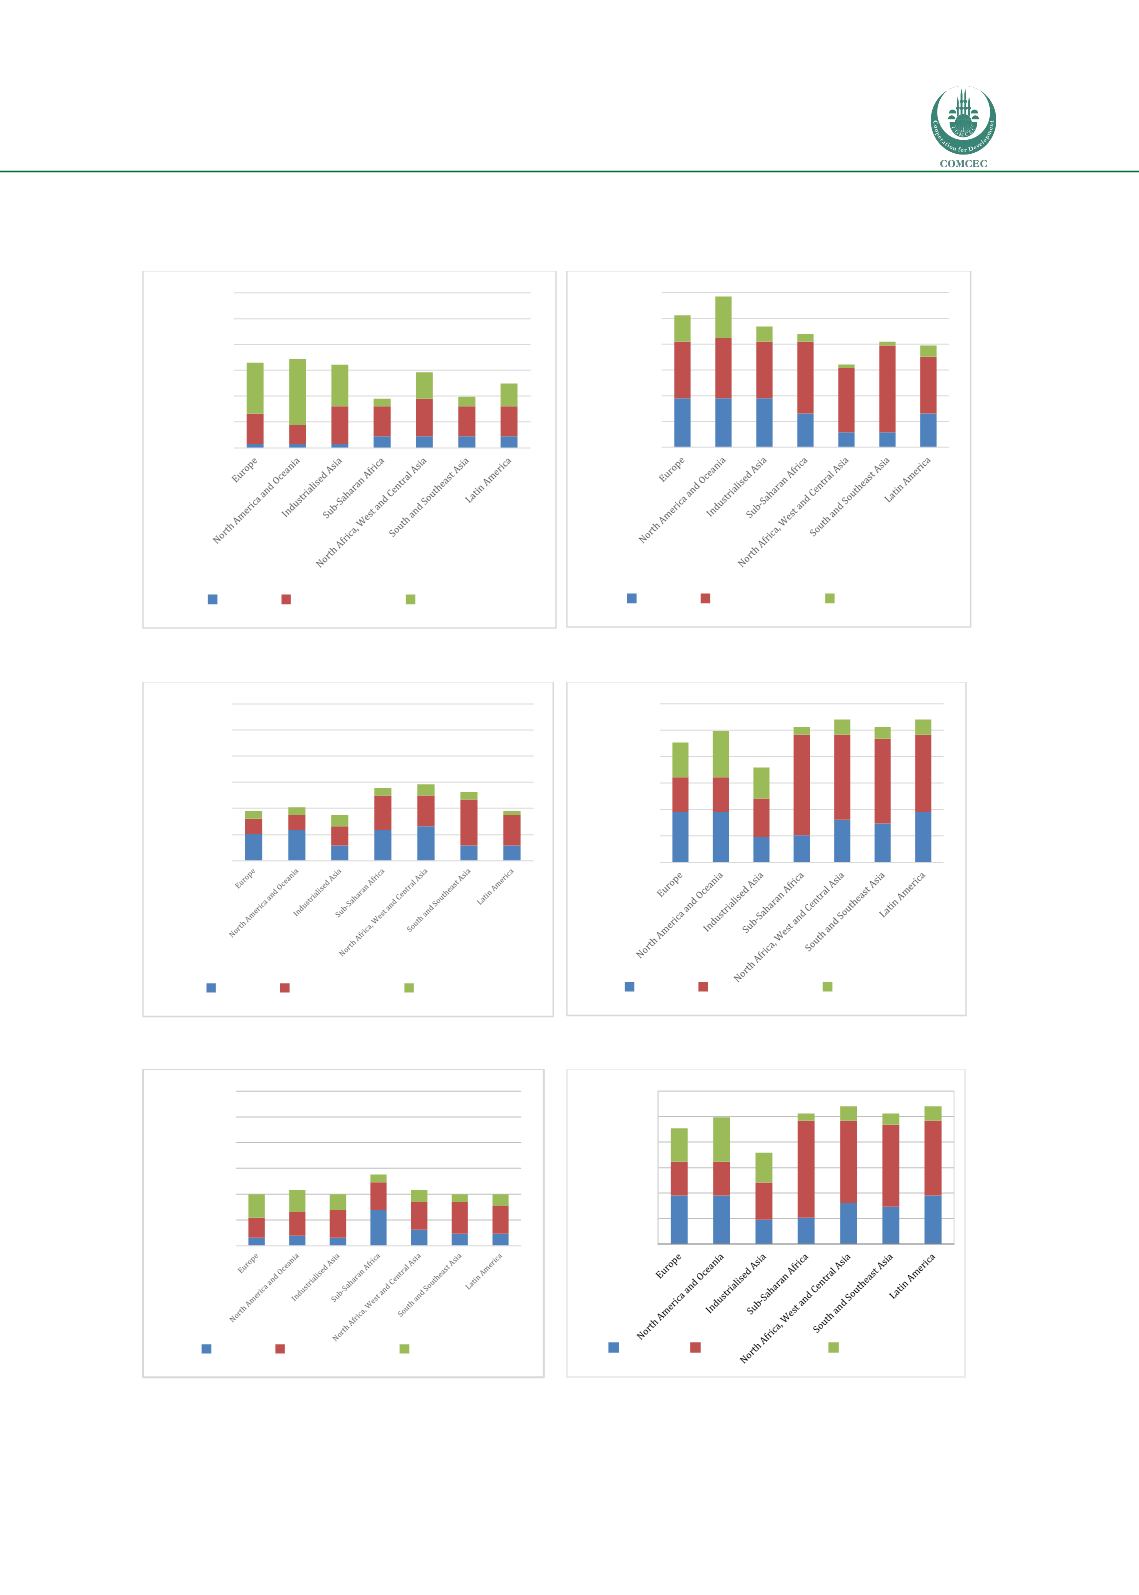
Figure 2: On-farm losses, postharvest losses and consumer waste for commodity group by
region
a) Cereals b) Root and Tubers
c) Oilseeds and Pulses
d) Fruit and Vegetables
e) Meat and Meat Products
f) Dairy and Dairy Products
0%
10%
20%
30%
40%
50%
60%
Postharvest loss (%)
Farm Postharvest
Consumer
0%
10%
20%
30%
40%
50%
60%
Postharvest loss (%)
Farm Postharvest
Consumer
0%
10%
20%
30%
40%
50%
60%
Postharvest loss (%)
Farm Postharvest
Consumer
0%
10%
20%
30%
40%
50%
60%
Postharvest loss (%)
Farm Postharvest
Consumer
0%
10%
20%
30%
40%
50%
60%
Postharvest loss (%)
Farm Postharvest
Consumer
0%
10%
20%
30%
40%
50%
60%
Postharvest loss (%)
Farm Postharvest
Consumer