
Reducing Food Waste
In the OIC Member Countries
COMCEC
Looking at Table 50, we can see tha t Afghanistan households are those who waste by far the
m o st food at the preparation step, fo llow by Turkish and Uzbekistan households. They waste
especially a lo t o f fruits and vegetables as well as bead and cereals. The respondents tha t
reported to waste the less are the Beninese ones, tha t reported to waste 582 grams o f food per
week at the p reparation step, they waste particularly few dairy products and sweets. In general,
a t the preparation step, it is the
sugar and sweets
(8,183g] category tha t is wasted the less,
followed by the
dairy products
(14,826g] category, and it is the
fruits & vegetables
(33,617g]
category tha t is wasted the m o st followed by the
bread and cereals
(24,450g] category.
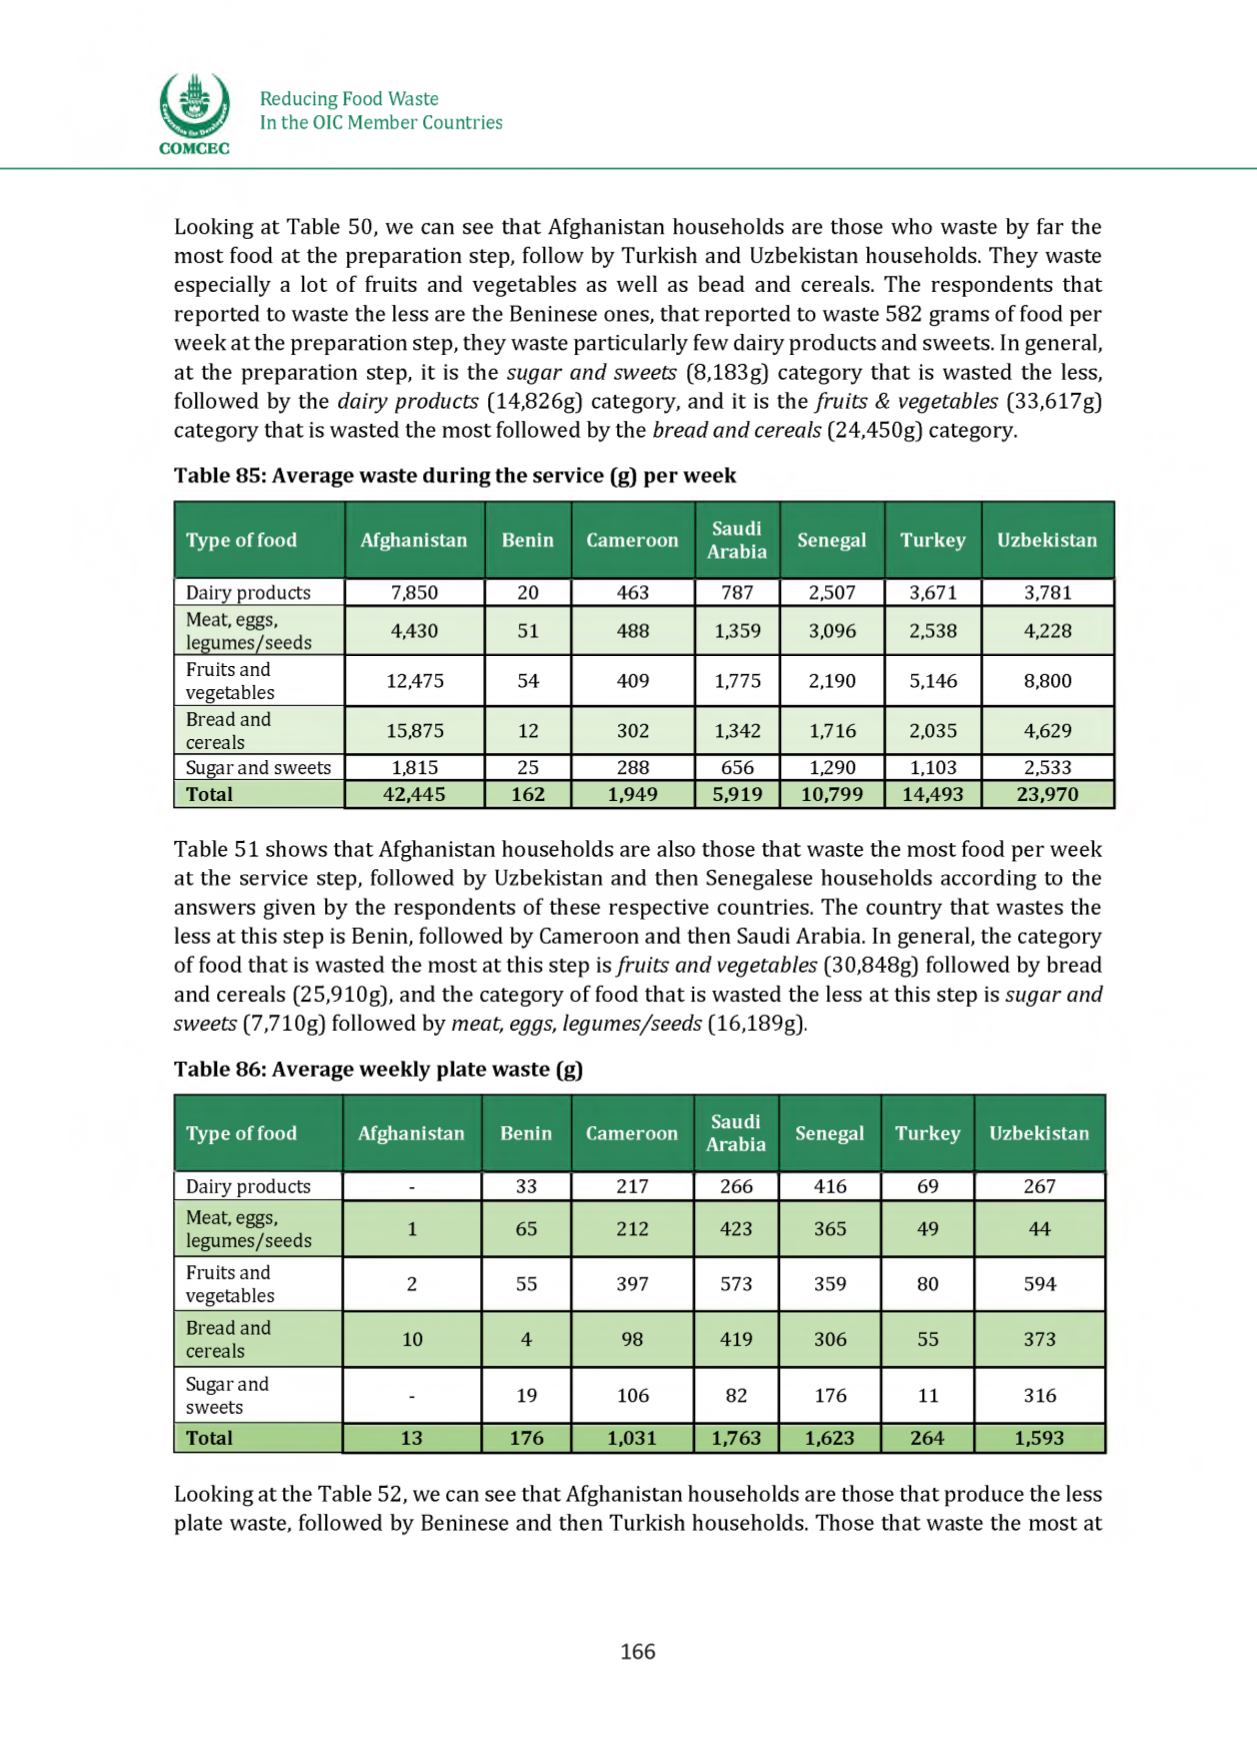
Table 85: Average waste during the service (g) per week
Type of food
Afghanistan Benin Cameroon Saudi
Arabia Senegal
Turkey Uzbekistan
Dairy products
7,850
20
463
787
2,507
3,671
3,781
Meat, eggs,
legumes/seeds
4,430
51
488
1,359 3,096
2,538
4,228
Fruits and
vegetables
12,475
54
409
1,775 2,190
5,146
8,800
Bread and
cereals
15,875
12
302
1,342 1,716
2,035
4,629
Sugar and sweets
1,815
25
288
656
1,290
1,103
2,533
Total
42,445
162
1,949
5,919 10,799 14,493
23,970
Table 51 shows tha t Afghanistan households are also those tha t waste the m o st food per week
a t the service step, followed by Uzbekistan and then Senegalese households according to the
answers given by the respondents of these respective countries. The country tha t wastes the
less at this step is Benin, followed by Cameroon and then Saudi Arabia. In general, the category
of food th a t is wasted the m o st at this step is
fruits and vegetables
(30,848g] followed by bread
and cereals (25,910g], and the category o f food th a t is wasted the less a t this step is
sugar and
sweets
(7,710g] followed by
meat, eggs, legumes/seeds
(16,189g).
Table 86: Average weekly plate waste (g)
Type of food
Afghanistan Benin Cameroon Saudi
Arabia Senegal
Turkey Uzbekistan
Dairy products
-
33
217
266
416
69
267
Meat, eggs,
legumes/seeds
1
65
212
423
365
49
44
Fruits and
vegetables
2
55
397
573
359
80
594
Bread and
cereals
10
4
98
419
306
55
373
Sugar and
sweets
-
19
106
82
176
11
316
Total
13
176
1,031
1,763 1,623
264
1,593
Looking at the Table 52, we can see tha t Afghanistan households are those tha t produce the less
plate waste, followed by Beninese and then Turkish households. Those tha t waste the m ost at
166


