


 130 / 213

COMCEC
Reducing Food Waste
In the OIC Member Countries
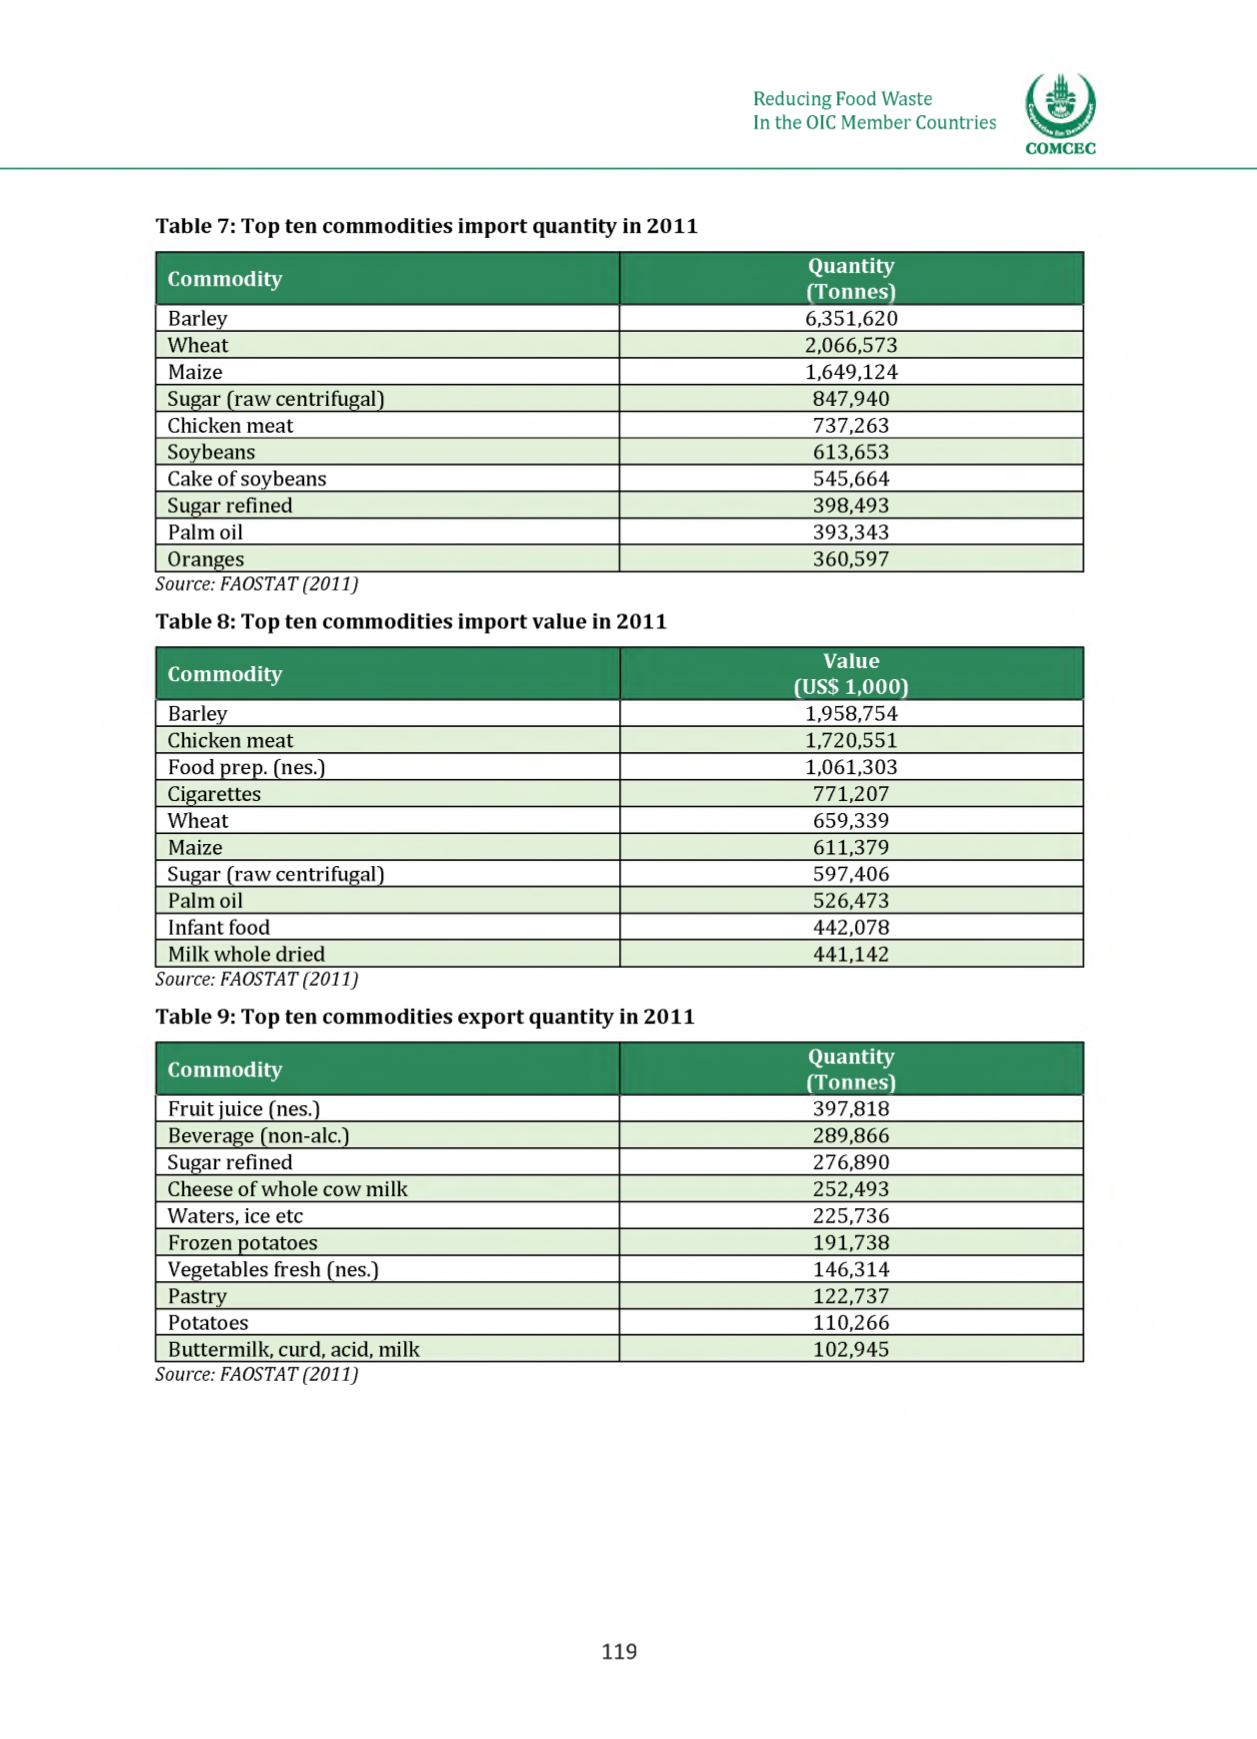
Table 7: Top ten commodities import quantity in 2011
Commodity
Quantity
(Tonnes)
Barley
6,351,620
Wheat
2,066,573
Maize
1,649,124
Sugar (raw centrifugal)
847,940
Chicken meat
737,263
Soybeans
613,653
Cake of soybeans
545,664
Sugar refined
398,493
Palm oil
393,343
Oranges
360,597
Source: FAOSTAT (2011)
Table 8: Top ten commodities import value in 2011
Value
Commodity
(US$ 1,000)
Barley
1,958,754
Chicken meat
1,720,551
Food prep. (nes.)
1,061,303
Cigarettes
771,207
Wheat
659,339
Maize
611,379
Sugar (raw centrifugal)
597,406
Palm oil
526,473
Infant food
442,078
Milk whole dried
441,142
Source: FAOSTAT (2011)
Table 9: Top ten commodities export quantity in 2011
Commodity
Quantity
(Tonnes)
Fruit juice (nes.)
397,818
Beverage (non-alc.)
289,866
Sugar refined
276,890
Cheese of whole cow m ilk
252,493
Waters, ice etc
225,736
Frozen potatoes
191,738
Vegetables fresh (nes.)
146,314
Pastry
122,737
Potatoes
110,266
Buttermilk, curd, acid, m ilk
102,945
Source: FAOSTAT (2011)
119