


 134 / 213

COMCEC
Reducing Food Waste
In the OIC Member Countries
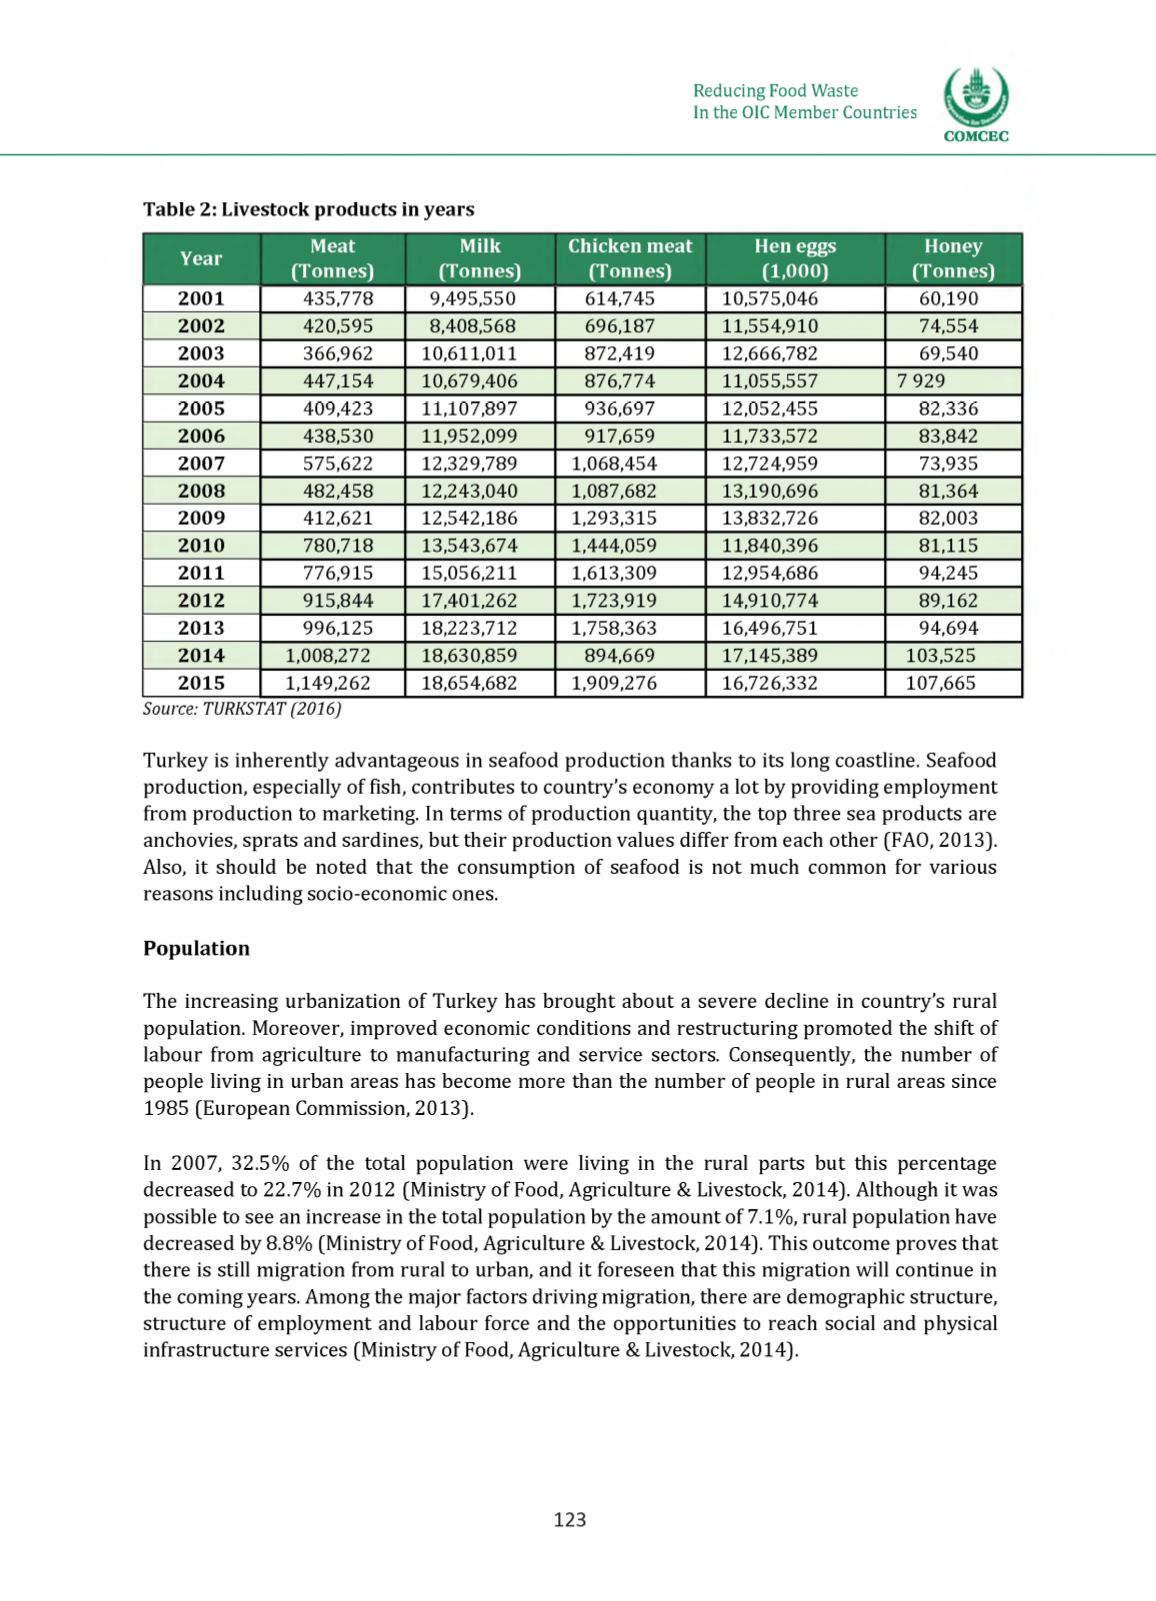
Table 2: Livestock products in years
Year
Meat
(Tonnes)
Milk
(Tonnes)
Chicken meat
(Tonnes)
Hen eggs
(1,000)
Honey
(Tonnes)
2001
435,778
9,495,550
614,745
10,575,046
60,190
2002
420,595
8,408,568
696,187
11,554,910
74,554
2003
366,962 10,611,011
872,419
12,666,782
69,540
2004
447,154 10,679,406
876,774
11,055,557
7 929
2005
409,423 11,107,897
936,697
12,052,455
82,336
2006
438,530 11,952,099
917,659
11,733,572
83,842
2007
575,622 12,329,789
1,068,454
12,724,959
73,935
2008
482,458 12,243,040
1,087,682
13,190,696
81,364
2009
412,621 12,542,186
1,293,315
13,832,726
82,003
2010
780,718 13,543,674
1,444,059
11,840,396
81,115
2011
776,915 15,056,211
1,613,309
12,954,686
94,245
2012
915,844 17,401,262
1,723,919
14,910,774
89,162
2013
996,125 18,223,712
1,758,363
16,496,751
94,694
2014
1,008,272 18,630,859
894,669
17,145,389
103,525
2015
1,149,262 18,654,682
1,909,276
16,726,332
107,665
Source: TURKSTAT (2016)
Turkey is inherently advantageous in seafood production thanks to its long coastline. Seafood
production, especially of fish, contributes to country’s economy a lot by providing employment
from production to marketing. In terms of production quantity, the top three sea products are
anchovies, sprats and sardines, but their production values differ from each other (FAO, 2013].
Also, it should be noted that the consumption of seafood is not much common for various
reasons including socio-economic ones.
Population
The increasing urbanization of Turkey has brought about a severe decline in country’s rural
population. Moreover, improved economic conditions and restructuring promoted the shift of
labour from agriculture to manufacturing and service sectors. Consequently, the number of
people living in urban areas has become more than the number of people in rural areas since
1985 (European Commission, 2013].
In 2007, 32.5% of the total population were living in the rural parts but this percentage
decreased to 22.7% in 2012 (Ministry of Food, Agriculture & Livestock, 2014]. Although it was
possible to see an increase in the total population by the amount of 7.1%, rural population have
decreased by 8.8% (Ministry of Food, Agriculture & Livestock, 2014]. This outcome proves that
there is still migration from rural to urban, and it foreseen that this migration will continue in
the coming years. Among the major factors driving migration, there are demographic structure,
structure of employment and labour force and the opportunities to reach social and physical
infrastructure services (Ministry of Food, Agriculture & Livestock, 2014].
123