
COMCEC
Reducing Food Waste
In the OIC Member Countries
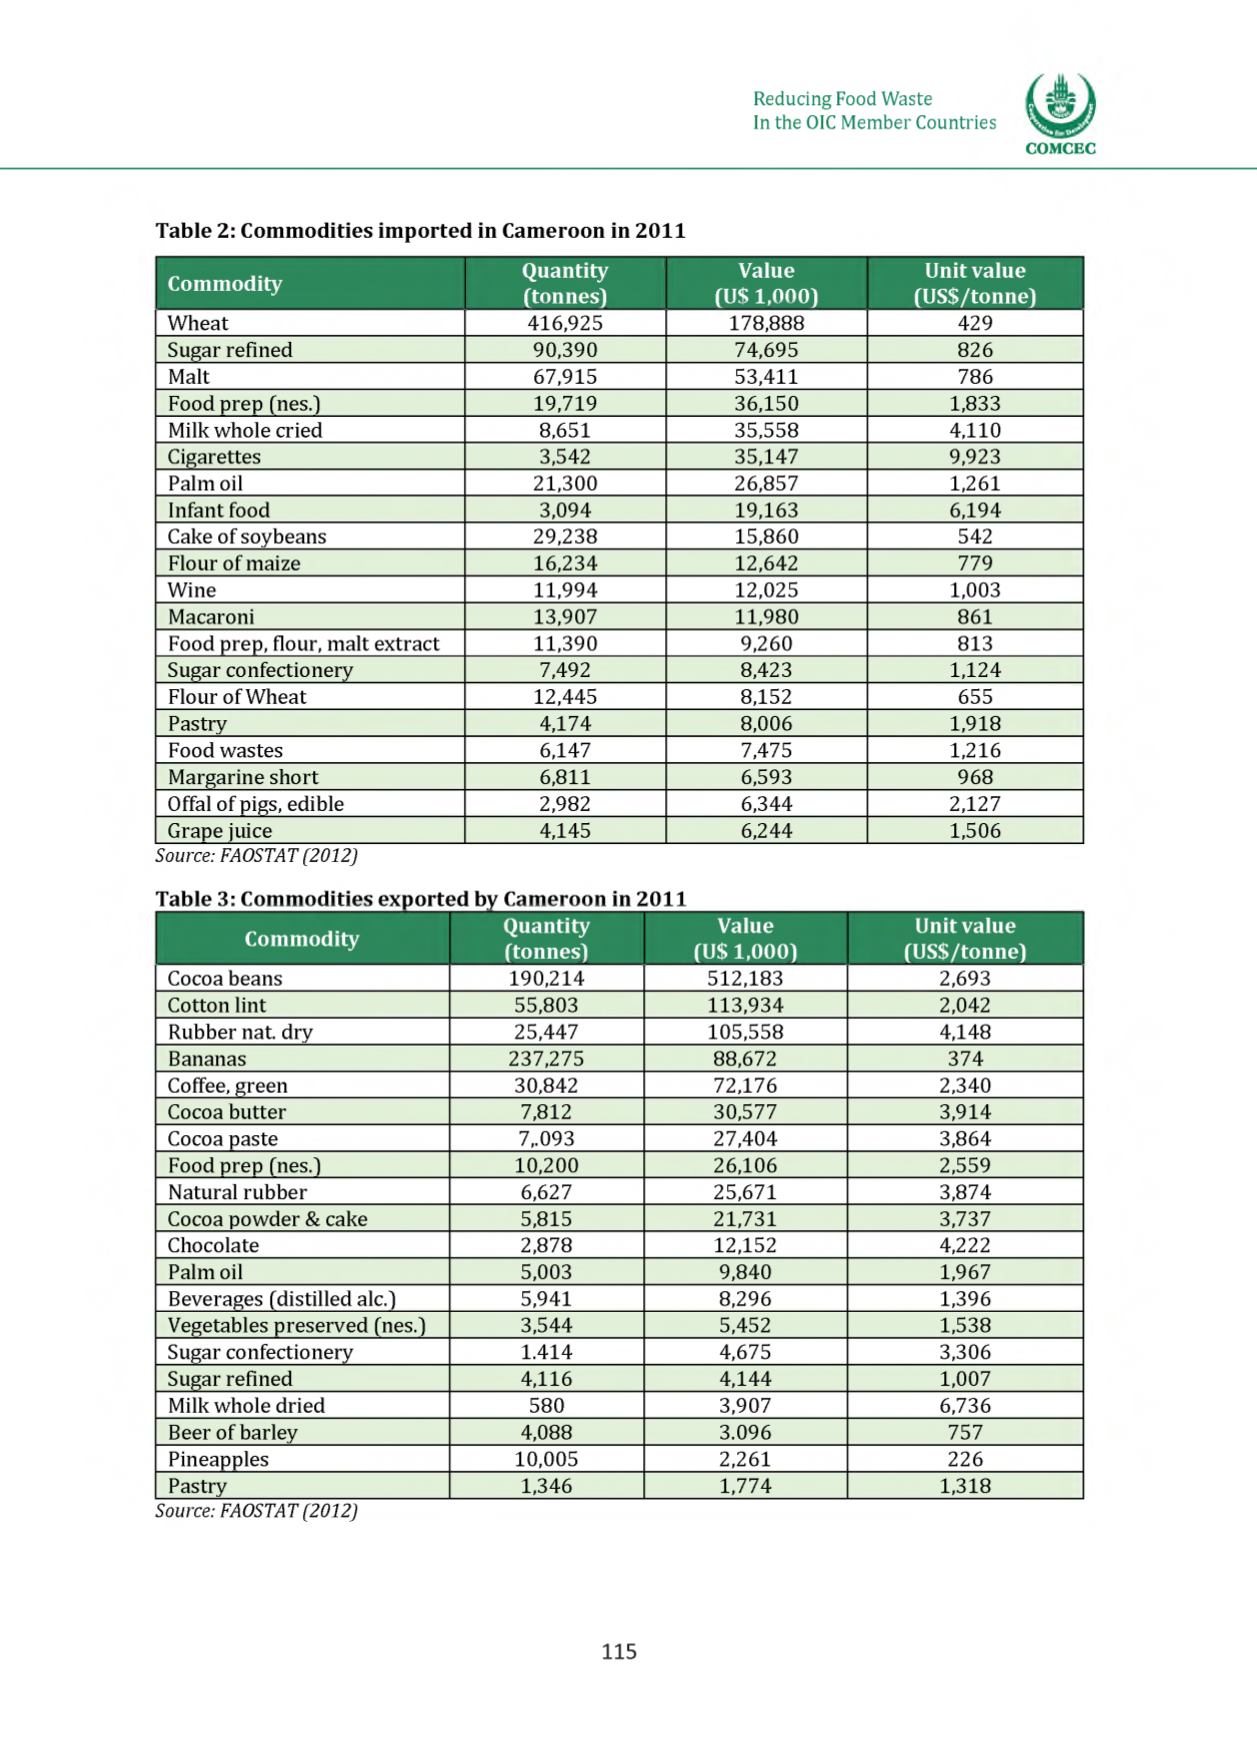
Table 2: Commodities imported in Cameroon in 2011
Commodity
Quantity
(tonnes)
Value
(U$ 1,000)
Unit value
(US$/tonne)
Wheat
416,925
178,888
429
Sugar refined
90,390
74,695
826
Malt
67,915
53,411
786
Food prep (nes.)
19,719
36,150
1,833
Milk whole cried
8,651
35,558
4,110
Cigarettes
3,542
35,147
9,923
Palm oil
21,300
26,857
1,261
Infant food
3,094
19,163
6,194
Cake of soybeans
29,238
15,860
542
Flour of maize
16,234
12,642
779
Wine
11,994
12,025
1,003
Macaroni
13,907
11,980
861
Food prep, flour, malt extract
11,390
9,260
813
Sugar confectionery
7,492
8,423
1,124
Flour ofWheat
12,445
8,152
655
Pastry
4,174
8,006
1,918
Food wastes
6,147
7,475
1,216
Margarine short
6,811
6,593
968
Offal of pigs, edible
2,982
6,344
2,127
Grape juice
4,145
6,244
1,506
Source: FAOSTAT (2012)
Table 3: Commodities exported by Cameroon in 2011
Commodity
Quantity
(tonnes)
Value
(U$ 1,000)
Unit value
(US$/tonne)
Cocoa beans
190,214
512,183
2,693
Cotton lint
55,803
113,934
2,042
Rubber nat. dry
25,447
105,558
4,148
Bananas
237,275
88,672
374
Coffee, green
30,842
72,176
2,340
Cocoa butter
7,812
30,577
3,914
Cocoa paste
7,.093
27,404
3,864
Food prep (nes.)
10,200
26,106
2,559
Natural rubber
6,627
25,671
3,874
Cocoa powder & cake
5,815
21,731
3,737
Chocolate
2,878
12,152
4,222
Palm oil
5,003
9,840
1,967
Beverages (distilled alc.)
5,941
8,296
1,396
Vegetables preserved (nes.)
3,544
5,452
1,538
Sugar confectionery
1.414
4,675
3,306
Sugar refined
4,116
4,144
1,007
Milk whole dried
580
3,907
6,736
Beer of barley
4,088
3.096
757
Pineapples
10,005
2,261
226
Pastry
1,346
1,774
1,318
Source: FAOSTAT(2012)
115


