
Promoting Agricultural Value Chains:
In the OIC Member Countries
46
9%
50%
41%
Imports
African Group Arab Group Asian Group
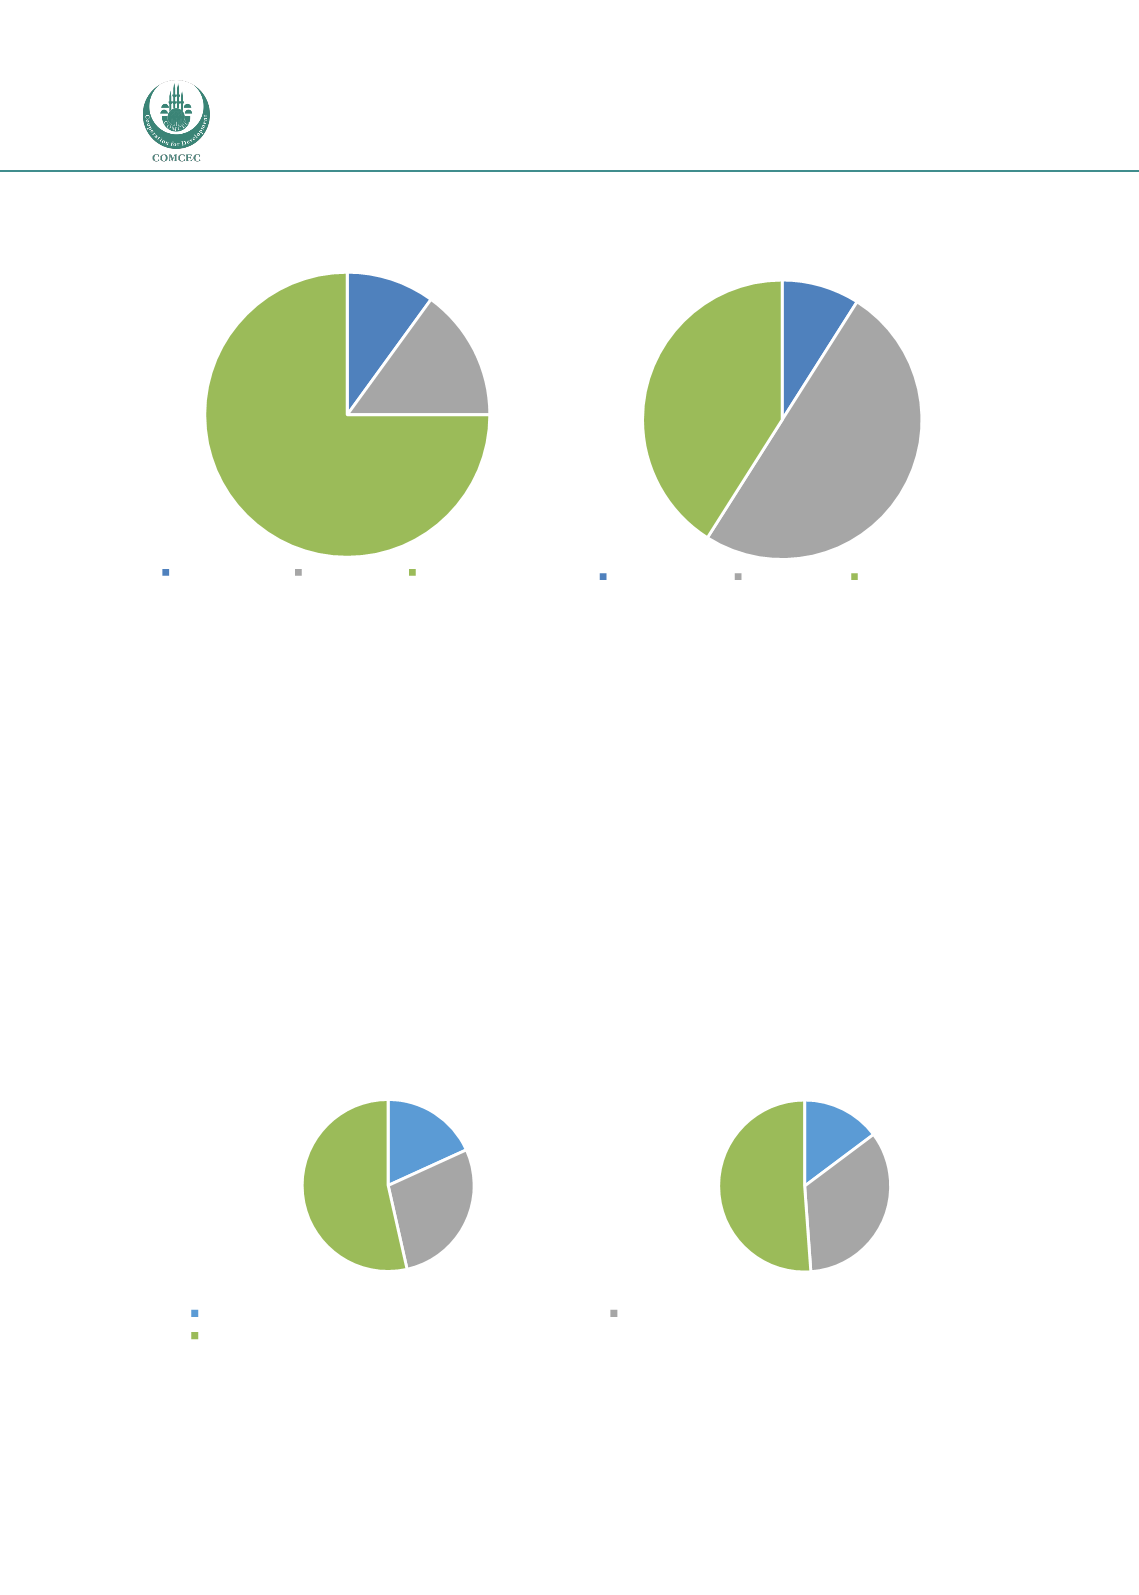
Figure 3-12 Share of OIC agricultural trade, 2013
Source: FAOSTAT, 2015
The biggest importers are Saudi Arabia, Malaysia and Indonesia, comprising 27 percent of total
OIC imports.
The biggest exporters of agricultural products are Indonesia, Malaysia and Turkey. These
countries together account for 63 percent of the OIC’s total agricultural commodity exports.
Indonesia, Malaysia and Turkey are net exporters; whereas, Saudi Arabia is a net importer.
In 2013, 54 percent of the total exports of OIC Member Countries went to high-income
countries, 28 percent went to developing countries outside the region and 18 percent went to
developing countries within the region. This picture is similar when looking at the total
imports of OIC countries. Again, about half (51 percent) of the imports come from high-income
countries, 34 percent from developing countries outside the region and 15 percent from
developing countries inside the region (se
e Figure 3-13).
Figure 3-13 Trade in OIC Countries, 2013
Source: World Bank Development Indicators, 2015
10%
15%
75%
Exports
African Group Arab Group Asian Group
18%
28%
54%
Exports
15%
34%
51%
Imports
To/From developing economies, Within region
To/From developing economies, Outside region
To/From high-income economies


