


 54 / 142

Promoting Agricultural Value Chains
In the OIC Member Countries
45
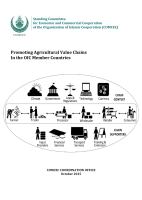
Table 3-3 Impact of Halal requirements on the value chain
Food industry
segment
Halal process impact
Main companies and other
organisations
Core suppliers
Core feeding, slaughtering and handling of
animals and animal products that adhere to
Islamic rulings. Halal certification of core
food preservatives and other ingredients.
Brazil Food Company (Brazil)
Allanasons (India)
American Foods Group (USA)
Cargill (USA)
Technology
Specialised technologies to facilitate
slaughtering of animals and related
management technologies.
Food processing Halal certification of sourced food supplies
and all ingredients used in producing and
managing the food.
Nestlé (Switzerland)
Al Islami (UAE)
Saffron Road (USA)
Tahira Foods (UK)
Arman (China)
Channels
Retailers focus on creating space and
positioning of halal food products. This is
especially relevant in markets where
Muslims are not a majority.
Tesco (UK)
Carrefour (France)
BIM (Turkey)
Marrybrown Sdn Bhd (Malaysia)
Lulu (UAE)
Logistics
An important aspect of ensuring the purity of
the halal concept is making sure that the
global distribution of halal food is kept pure
and not in contact with non-halal food items.
Eco-system
Training, R&D, marketing, financial services,
regulations, and compliance are all need to
address halal needs.
SMICC (OIC / Turkey)
International Halal Integrity Alliance
(Malaysia)
JAKIM (Malaysia)
IFANCA (USA)
ESMA (UAE)
MUI (Indonesia)
Source: Reuters & Dinar Standard, 2015
There is still a long way to go, but there are signs of increased scrutiny by OIC governments on
the Halal integrity of food products. In October 2014, for example, Qatari authorities pulled
several American-branded, pre-packaged meat products from the shelves, claiming they were
un-Halal. They removed products including well-known brands such as Sara Lee’s Cracked
Pepper Turkey Breast, Ball Park’s Beef Franks and Hillshire Farm’s Turkey Lit’l Smokies
(Reuters & Dinar Standard, 2015).
3.4Participation in global value chains
Overall, trade in agricultural products in OIC Member Countries has grown tremendously from
2002 to 2012. Total agricultural product exports increased from US$ 33.8 billion in 2002 to
US$ 132.7 billion in 2012. At the same time, agricultural product imports rose from US$ 53.5
billion in 2002 to US$ 208 billion in 2012. As imports are higher than exports, the OIC is a net
importer of food products. It is noteworthy that no less than 85 percent of OIC countries’ meat
and live animal imports come from non-OIC countries (Reuters & Dinar Standard, 2015).
There are, however, big differences between countries when it comes to trade deficits and
surpluses. Typically, Arab countries are importers of agricultural products, comprising 50
percent of OIC import value, followed by Asia, with 41 percent. Asian OIC countries are the top
exporters, with 75 percent, followed by Arab countries, with 15 percent (se
e Figure 3-12). As a
group, Asian OIC countries are net exporters. Arab and African are net importers.