


 36 / 235

Facilitating Smallholder Farmers’ Market Access
In the OIC Member Countries
26
Food and agricultural exports constitute about 21 percent of national merchandise
exports, and the composition of agricultural trade has changed substantially since the
early 1990s
(Table 5). Imports of wheat and vegetable oils (palm and soybean oil) have
grown significantly, while maize imports declined after domestic maize production
increased. The export base has diversified well beyond the relatively narrow range of
commodities exported in the early 1990s. Today, tobacco and sugar are the largest
agricultural exports, followed by sesame seeds, cotton lint, and cashews.
TABLE 5: MOZAMBIQUE’S TOP IMPORTS AND EXPORTS BY VALUE (2005 US$ THOUSANDS)
Source:
Authors’ calculations, based on FAOSTAT (FAO 2014) and World Development Indicators (World Bank
2014h).
Note:
* denotes that data were not available for all years.
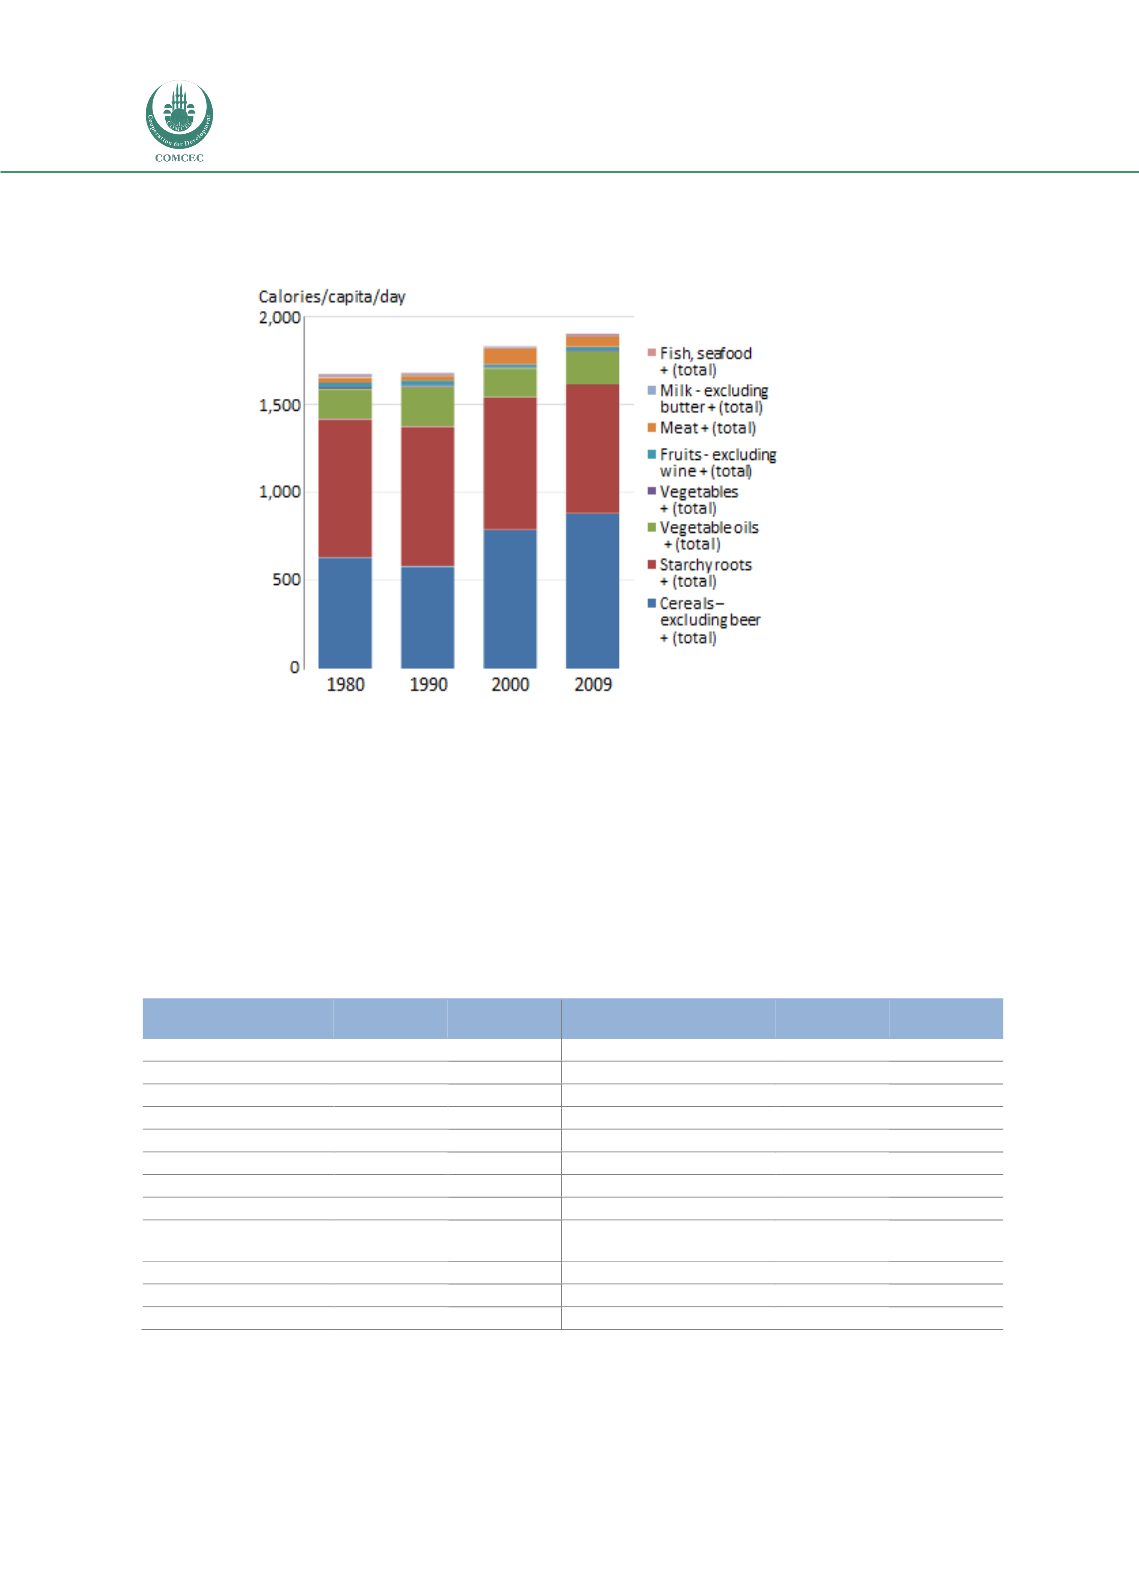
FIGURE 12: DAILY PER CAPITA CONSUMPTION OF CALORIES IN MOZAMBIQUE,
1980–2009
Source:
FAOSTAT (FAO 2014).
Imports
Average
(1989–91)
Average
(2009–11)
Exports
Average
(1989–91)
Average
(2009–11)
Wheat
30,048
101,348
Tobacco, unmanufactured
n/a
167,204
Oil, palm
24,714
48,387
Sugar, raw centrifugal
7,642
86,450
Food prep nes
n/a
42,967
Sesame seed
n/a
34,287
Sugar, refined
21,589
41,179
Cotton lint
8,300
30,640
Oil, soybean
3,349
30,905
Cashew nuts, shelled
16,781
18,533
Maize
69,241
24,659
Flour, wheat
n/a
12,418
Cake, soybeans
n/a
20,077
Molasses
20*
10,745
Meat, chicken
1,535
18,969
Bananas
50*
8,272
Tobacco,
unmanufactured
1,259
17,940
Sugar, refined
n/a
5,467
Sugar confectionery
n/a
13,509
Groundnuts, shelled
190
4,190
Wine
4,309
13,388
Cottonseed
n/a
3,486
Cigarettes
n/a
11,512
Maize
n/a
3,134