
Facilitating Smallholder Farmers’ Market Access
In the OIC Member Countries
23
CHAPTER 2: CASE STUDIES ON LINKING SMALLHOLDER
FARMERS TO MARKETS IN OIC MEMBER COUNTRIES
This chapter presents the case studies from eight OIC member countries. The case studies
focus on the extent to which smallholder farmers participate in different crop-related
markets and highlight factors that limit or enhance their participation in those markets.
Mozambique
Competitiveness and sustainability issues
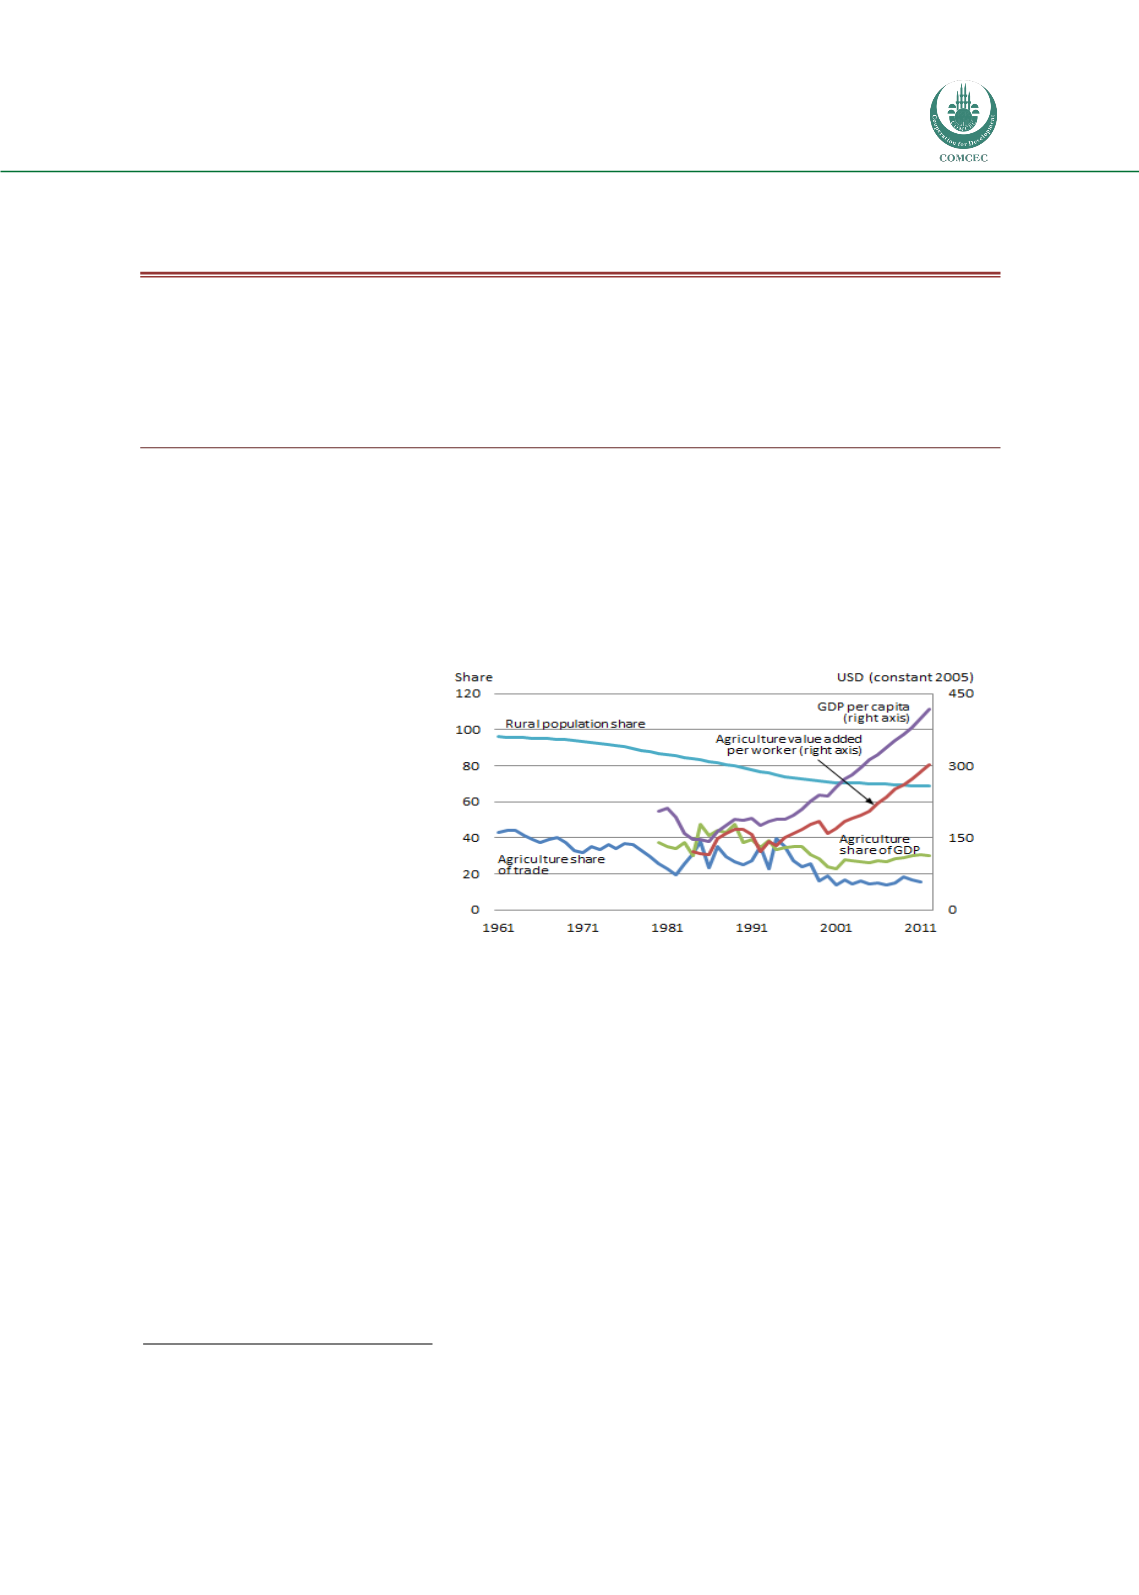
Agriculture is the second-largest sector in Mozambican economy, contributing 24 percent
of GDP and employing 78 percent of the workforce in 2011
(Figure 9). Growth in the
agricultural
sector
has
averaged about 7 percent
annually since 2003 and has
contributed significantly to
overall economic growth,
although agriculture’s share
of the economy has been
declining since the 1980s
30
.
Growth in agriculture has
been driven mainly by the
expansion in cultivated area
and labor after the extended
civil conflict ended and
refugees
resettled
rural
areas.
31
Agricultural incomes
are growing, but so is the gap
between
agricultural
incomes and incomes in other sectors.
This vast country has more than 3.8 million farming enterprises, of which 71.6 percent are
smaller than 2 hectares
(Figure 10). The average cultivated area per household is only
about 1.4 hectares. The wide variety of regional cropping patterns reflects large regional
differences in rainfall, temperature, soil types, and market access. The country’s 10
agroecological zones can be broadly divided into three geographical regions: the North
(Niassa, Cabo Delgado, and Nampula), Center (Zambézia, Tete, Manica, and Sofala), and
South (Inhambane, Gaza, and Maputo Province). Mozambique’s climate ranges from arid
and semi-arid (mostly in the South and Southwest) to subhumid (mostly in the Center and
North) and humid zones (in the highlands, mostly in the Center). The arid southern and
southwestern parts of Gaza Province are suitable only for livestock production.
32
30
World Bank (2014h).
31
World Bank (2012b).
32
World Bank (2006b).
FIGURE 9: STRUCTURAL CHANGE AND THE MOZAMBICAN
ECONOMY, 1960–2012
Source:
World Development Indicators (World Bank 2014h).


