


 30 / 235

Facilitating Smallholder Farmers’ Market Access
In the OIC Member Countries
20
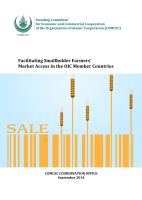
TABLE 2: COMPOSITION OF FOOD AND AGRICULTURAL TRADE FOR OIC MEMBER COUNTRIES
Imports
Share of total
import value
Exports
Share of total
export value
Wheat and meslin, unmilled
13.9%
Coffee, tea, cocoa, spices
22.6%
Sugar
10.0%
Fruit and nuts, excluding oil nuts
17.4%
Dairy, eggs
9.6%
Fish, crustaceans, molluscs
13.8%
Rice
11.3%
Vegetables
8.7%
Meat, meat preparations
8.1%
Miscellaneous edible products
8.0%
Coffee, tea, cocoa, spices
7.9%
Dairy, eggs
7.3%
Feed
7.4%
Sugar
5.9%
Miscellaneous edible products
7.4%
Rice
5.6%
Maize
6.2%
Feed
3.0%
Fruit and nuts, excluding oil nuts
5.6%
Live animals
2.6%
Vegetables
4.7%
Wheat and meslin, unmilled
2.4%
Fish, crustaceans, molluscs
4.6%
Meat, meat preparations
2.1%
Live animals
2.8%
Maize
0.3%
Barley
2.8%
Barley
0.2%
Total value (US$ billions)
114.8
Total value (US$ billions)
57.4
Source:
UN COMTRADE Database (UN 2014).
Note:
Figures based on average export values between 2008 and 2012 using SITC Rev 3.
While export markets present significant opportunities for smallholder farmers in OIC
member countries, particularly the more commercially oriented farmers, increases in
demand in domestic markets generally dwarf the opportunities presented by export
markets.
Table 3compares estimates of domestic gross production values for the top 10
sources (Annex Table 1.28) with export values for the top 10 sources for seven of the eight
case study countries. Indonesia and Jordan stand out from the other countries because the
export values of their top 10 commodities are close to 70 percent of the value of gross
domestic production from their top 10 sources. The comparable shares for the other case
study countries are less than 15 percent.
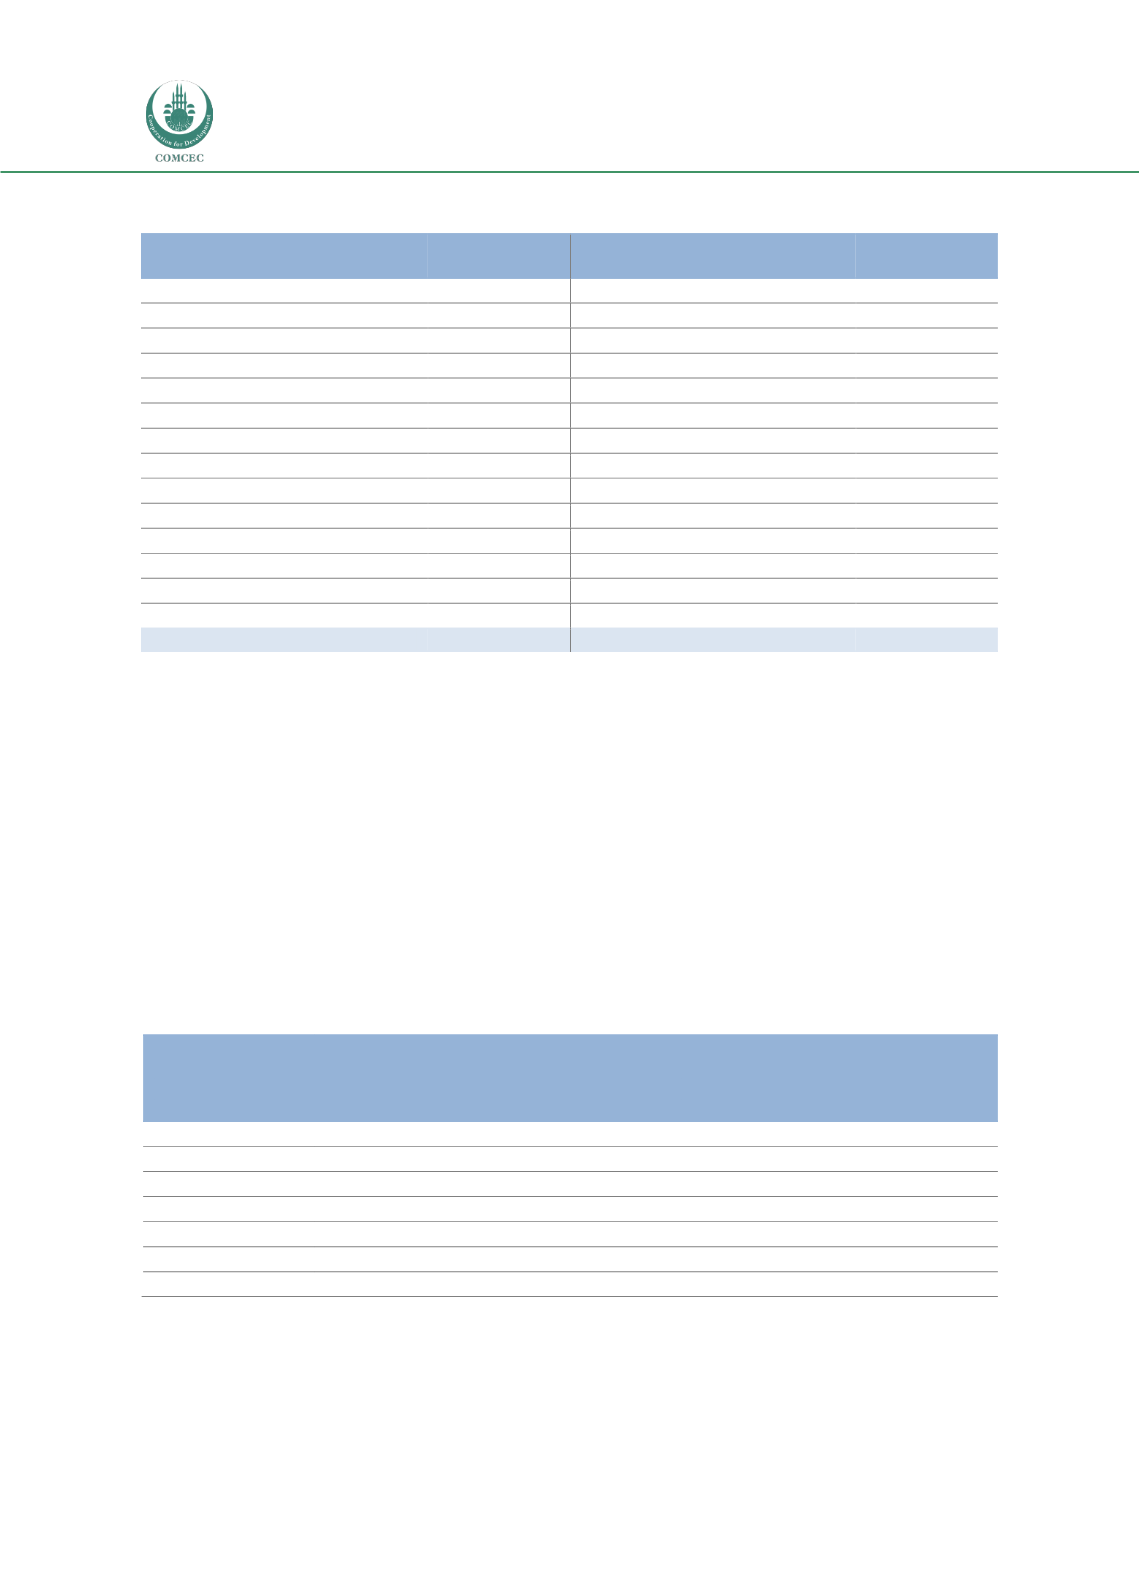
TABLE 3: VALUE OF DOMESTIC AGRICULTURAL PRODUCTION VERSUS AGRICULTURAL
EXPORTS IN CASE STUDY COUNTRIES
Case study
country
Domestic gross production value,
top 10 sources
(average of 2010–12, in constant 2004–
06 US$ millions)
Export value,
top 10 products
(average of 2009–11, in constant
2005 US$ millions)
Mozambique
2,920
378
Nigeria
29,304
1,026
Bangladesh
8,183
279
Indonesia
34,964
24,554
Turkey
31,932
4,752
Kyrgyz Republic
994
117
Jordan
820
564
Source:
Authors’ calculations, based on FAOSTAT (FAO 2014) and World Development Indicators (World Bank
2014h).
Note:
No data available for Uganda.