


 120 / 235

Facilitating Smallholder Farmers’ Market Access
In the OIC Member Countries
110
Markets
Table 21shows the changing composition of trade in Jordan. Imports have shifted to feed
grains to support domestic poultry and livestock production, while wheat imports have
held steady. Exports have shifted to high-value horticultural goods and prepared food
items. These changes are a key part of the structural reallocation that has resulted in a
smaller sector with higher average incomes.
TABLE 21: JORDAN’S TOP IMPORTS AND EXPORTS BY VALUE (US$ 2005 MILLION)
Imports
Average
(2009–11)
Average
(1989–91)
Exports
Average
(2009–11))
Average
(1989–91)
Sugar, refined
155,583
77,335
Tomatoes
189,042
38,725
Maize
153,360
69,545
Cucumbers and gherkins
83,825
7,513
Food prep nes
140,978
18,674
Food prep nes
67,530
4,276
Cake, soybeans
112,653
25,400
Peaches and nectarines
45,325
16
Wheat
111,612
103,075
Eggplants
34,821
4,443
Meat, cattle
97,774
1,685
Beverages, non alcoholic
31,707
3,593
Meat, sheep
81,909
24,461
Chillies and peppers
29,397
3,155
Cheese (cow)
78,361
11,582
Meat, chicken
27,994
445
Meat, chicken
62,858
31,316
Cigarettes
27,728
5,471
Milk, skimmed dried
59,237
17
Meat, beef, preparations
27,012
308
Beverages
58,318
52
Meat, cattle
24,082
n/a
Tobacco products nes
47,171
504
Meat, sheep
20,715
416*
Source:
Authors’ calculations, based on FAOSTAT (FAO 2014) and World Development Indicators (World Bank
2014h).
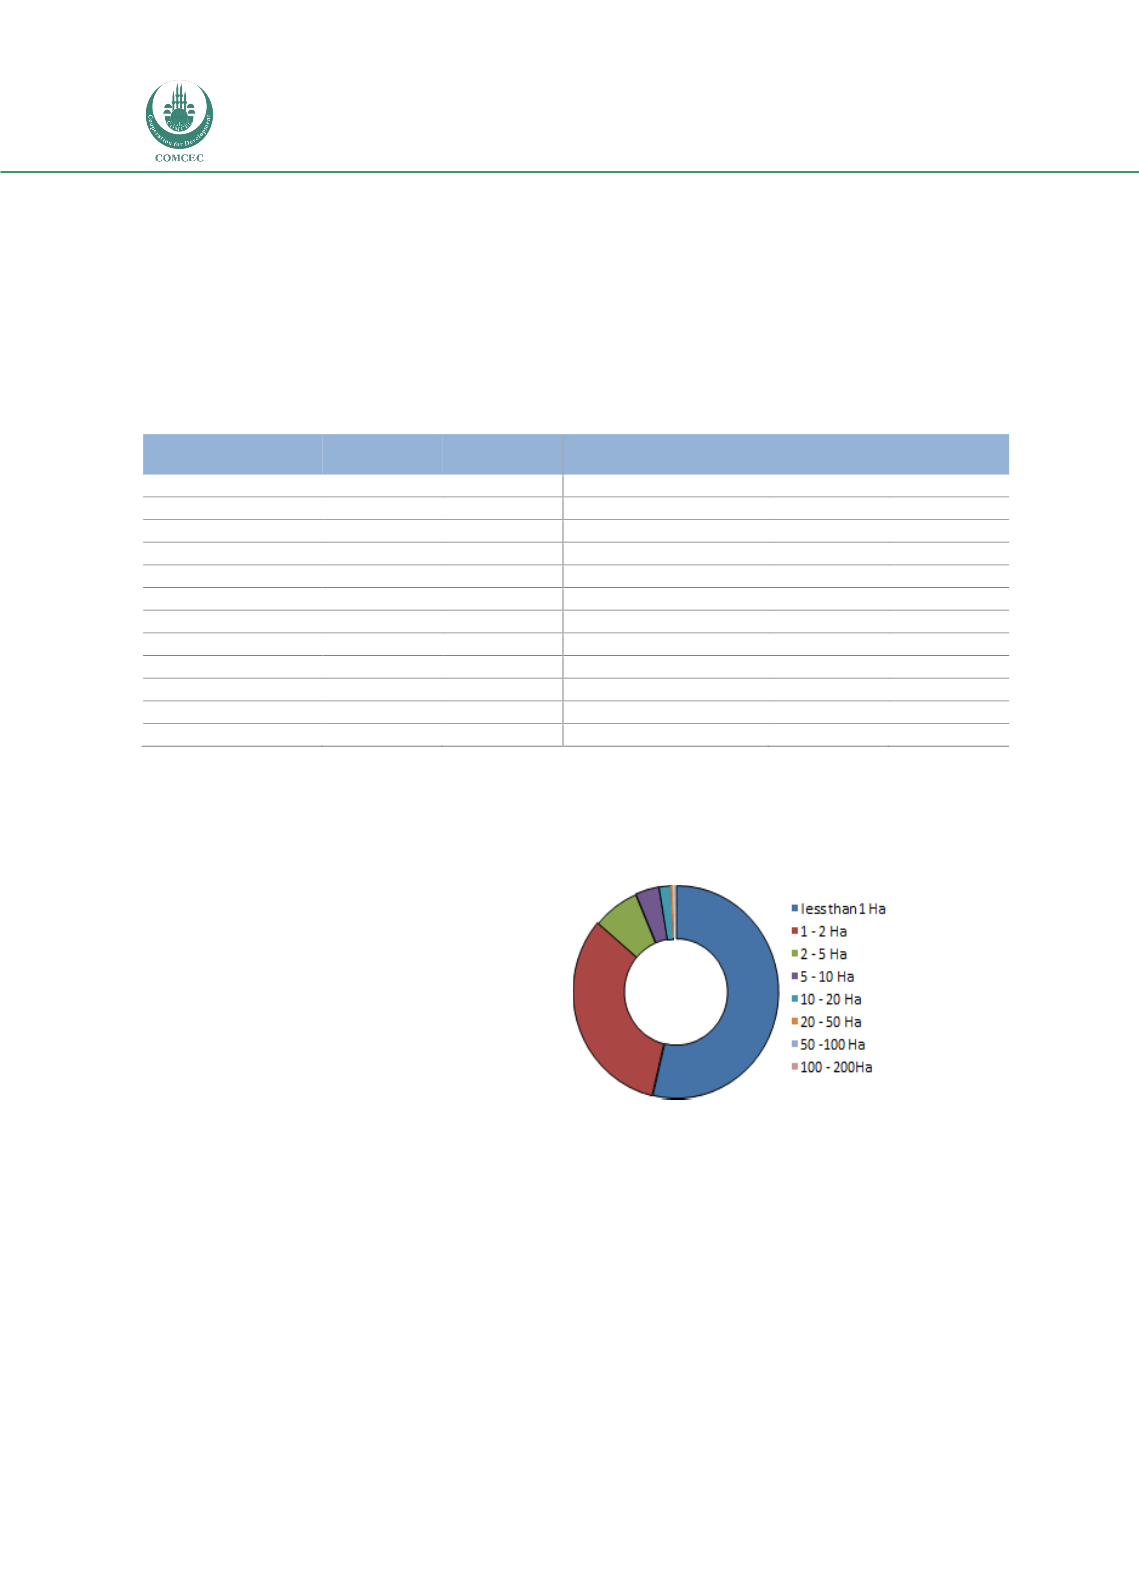
Despite these advantageous
developments, Jordan still faces
challenges in linking its farmers
to markets. The share of the
population living in rural areas
is shrinking, yet the most recent
data suggest that farms remain
small. In 1997, Jordan had few
farms larger than 2 hectares
(Figure 67). The trend to that
point was for farms to grow
smaller rather than larger
(Figure 68). Given the shrinking
share of the population living in rural areas, a consolidation of farms might be expected.
However, in absolute terms rural populations have grown. For example, the rural
population in Jordan in 2012 was more than 23 percent larger than in 1980. During the
same period, overall population density increased from about 25 to more than 71 people
per square kilometer of land.
FIGURE 67: FARM SIZE DISTRIBUTION IN JORDAN, 1997
Source: Lowder, Skoet, and Singh 2014.