


 103 / 235

Facilitating Smallholder Farmers’ Market Access
In the OIC Member Countries
93
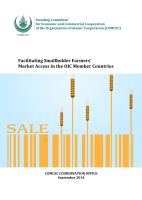
TABLE 18: GROSS PRODUCTION VALUE IN KYRGYZ REPUBLIC (CONSTANT 2004–06 US$
MILLIONS)
Item
Average (1990–92)
Average (2010–12)
Milk, whole fresh cow
154
222
Meat indigenous, cattle
179
205
Potatoes
46
191
Meat indigenous, sheep
222
127
Wheat
101
102
Cotton lint
23
45
Beans, dry
1*
35
Apples
10
29
Tomatoes
8
22
Carrots and turnips
2
15
Source:
FAOSTAT (FAO 2014).
Note:
* denotes that data were not available for all years.
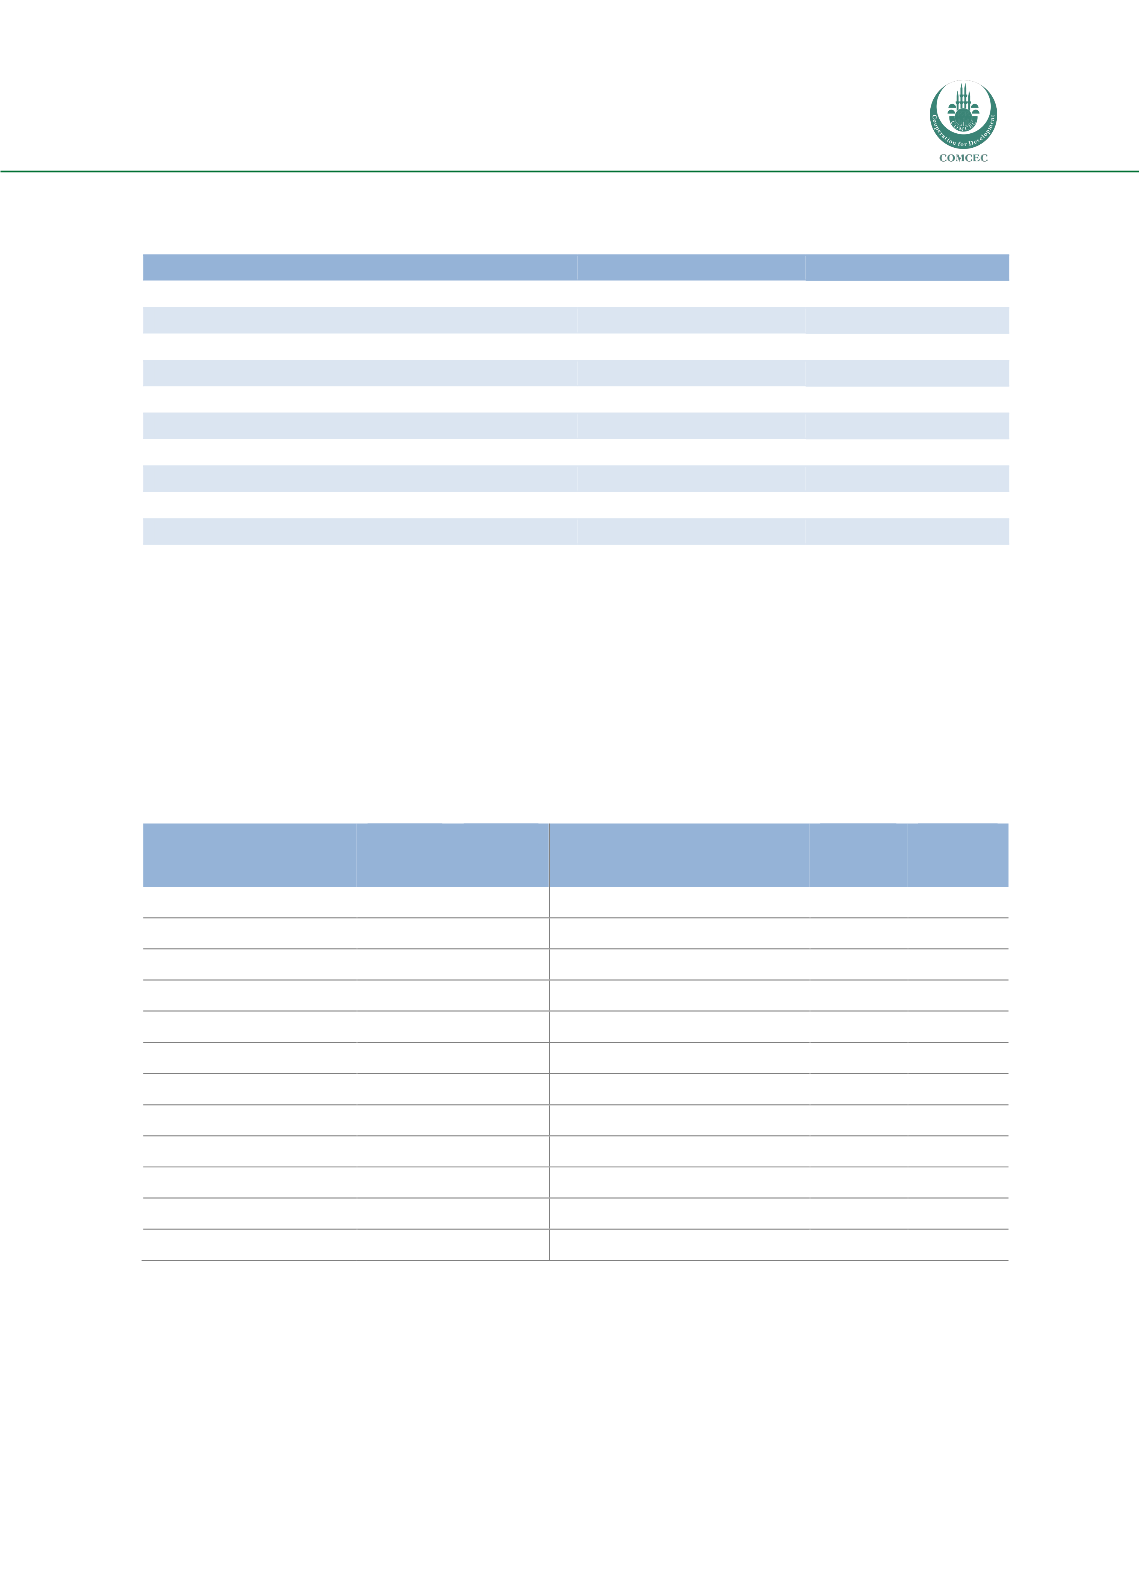
The composition of agricultural trade has also undergone substantial change
(Table 19).
The main imports include wheat, chocolate, sugar, and chicken. Wheat imports more than
halved in real terms between 2009/11 and 1992/94. On the export side, beans overtook
tobacco to become the largest export, and the country has also started exporting small
amounts of milk, other dairy products, potatoes, and carrots.
TABLE 19: KYRGYZ REPUBLIC’S TOP IMPORTS AND EXPORTS BY VALUE (2005 US$
THOUSANDS)
Imports
Average
(1992–
94)
Average
(2009–
11)
Exports
Average
(1992–
94)
Average
(2009–
11)
Wheat
123,264
57,989
Beans, dry
n/a
35,493
Chocolate products nes
323*
52,148
Cotton lint
12,570
24,231
Sugar, refined
53,295
51,103
Tobacco, unmanufactured
23,587*
14,603
Meat, chicken
n/a
42,727
Milk, whole fresh cow
n/a
9,249
Oil, sunflower
4,294
34,463
Potatoes
n/a
8,728
Cigarettes
802*
28,756
Carrots and turnips
n/a
5,851
Flour, wheat
37*
27,507
Onions, dry
4,981*
5,602
Beverages, non-alcoholic
392*
20,134
Beverages, non-alcoholic
n/a
4,944
Food prep nes
n/a
18,262
Cheese, whole cow milk
n/a
4,902
Pastry
5,772
17,208
Milk, skimmed dried
n/a
3,642
Beer of barley
417
15,250
Butter, cow milk
n/a
2,847
Sugar confectionery
553
14,159
Meat, sheep
n/a
1,765
Source:
Authors’ calculations, based on FAOSTAT (FAO 2014) and World Development Indicators (World Bank
2014h).
Note:
* denotes that data were not available for all years.