


 75 / 272

Reviewing Agricultural Trade Policies
To Promote Intra-OIC Agricultural Trade
63
3.5. Survey Results
This subsection is devoted to the analysis of the summary findings of the online survey. As
explained in Chapter 1, the main purpose of this survey is to obtain qualitative data on
stakeholders’ perceptions for an improved agricultural trade and policy capacity in OIC member
countries.
The summary analysis presented below builds upon on the completed responses of N = 46
participants, after the partial responses of 15 participants have been disregarded as they are
severely incomplete.
The 46 survey participants are dispersed over 21 OIC member countries, being composed of 3
countries (and 3 participants) from the African group, 10 countries (and 27 participants) from
the Arab group, and 8 countries (and 16 participants) from the Asian group. Around 40% of
these participants are working at relevant ministries in their countries, around 13% of them are
working at other government institutions, and around 9% of them are working at international
organizations and NGOs. A totality of around 35% of participants are working at chambers,
farmers’ associations and other private sector units, and universities.
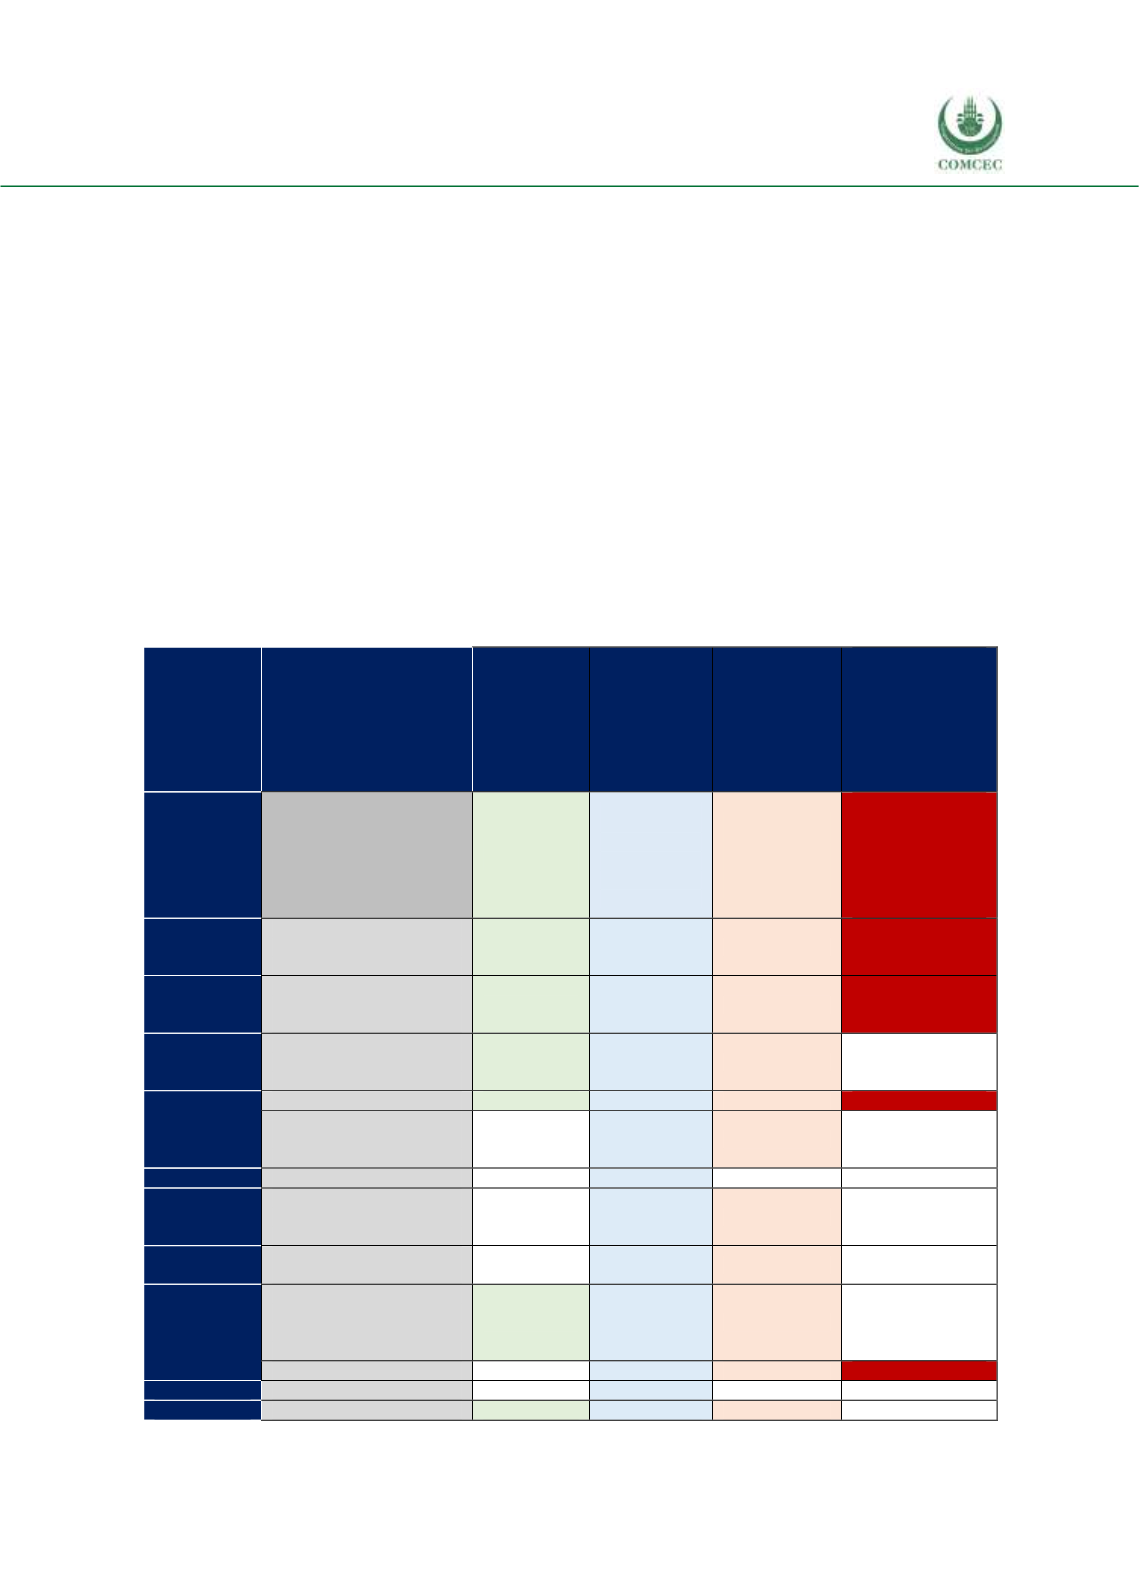
Table 3. 14 Country and Product Level Analysis of Top 5 Potential Product Divisions
Exporter
Product
Share of the
product in
the
exporter’s
total agr.
exports, %
Share of the
country in
the total
world export
of the
product, %
Share of OIC
as destination
for the
country's
export of the
product, %
Weighted average
tariff rates
implemented by
OIC members to
the country's
export of the
product, %
Thresholds for coloring
10.0
Country's
share in the
world
agricultural
exports, %
Share of OIC as
destination for
the country's
agr. exports, %
Weighted avg.
tariff rates
implemented by
OIC members to
the country's agr.
exports, %
Algeria
Other beet/cane sugar in
solid form, other than
flavoured/coloured matter
65,6
1,9
68,4
24,1
Azerbaijan
Other beet/cane sugar in
solid form, other than
flavoured/coloured matter
11,8
0,4
94,9
12,5
Bahrain
Other beet/cane sugar in
solid form, other than
flavoured/coloured matter
14,7
0,5
99,9
0,1
Chad
Sesame (Sesamum) seeds
42,7
1,0
99,1
12,4
Groundnuts (peanuts), not
roasted/othw. cooked,
shelled
0,7
0,0
100,0
7,5
Benin
Cotton seeds
1,7
3,1
25,2
-
Djibouti
Bovine animals, live, other
than pure-bred breeding
stock
1,9
0,0
100,0
-
Gabon
Bran, sharps & other
residues, of wheat
0,7
0,2
100,0
2,5
Guyana
Cane sugar, raw, in solid
form, not containing added
flavouring/colouring
matter
13,8
0,5
4,1
-
Live animals, n.e.s.
0,3
0,2
9,7
3,6
Kazakhstan
Linseed
4,8
12,8
26,7
2,6
Jordan
Sheep, live
10,8
11,0
92,7
-