


 76 / 152

Analysis of Agri-Food Trade Structures
To Promote Agri-Food Trade Networks
In the Islamic Countries
59
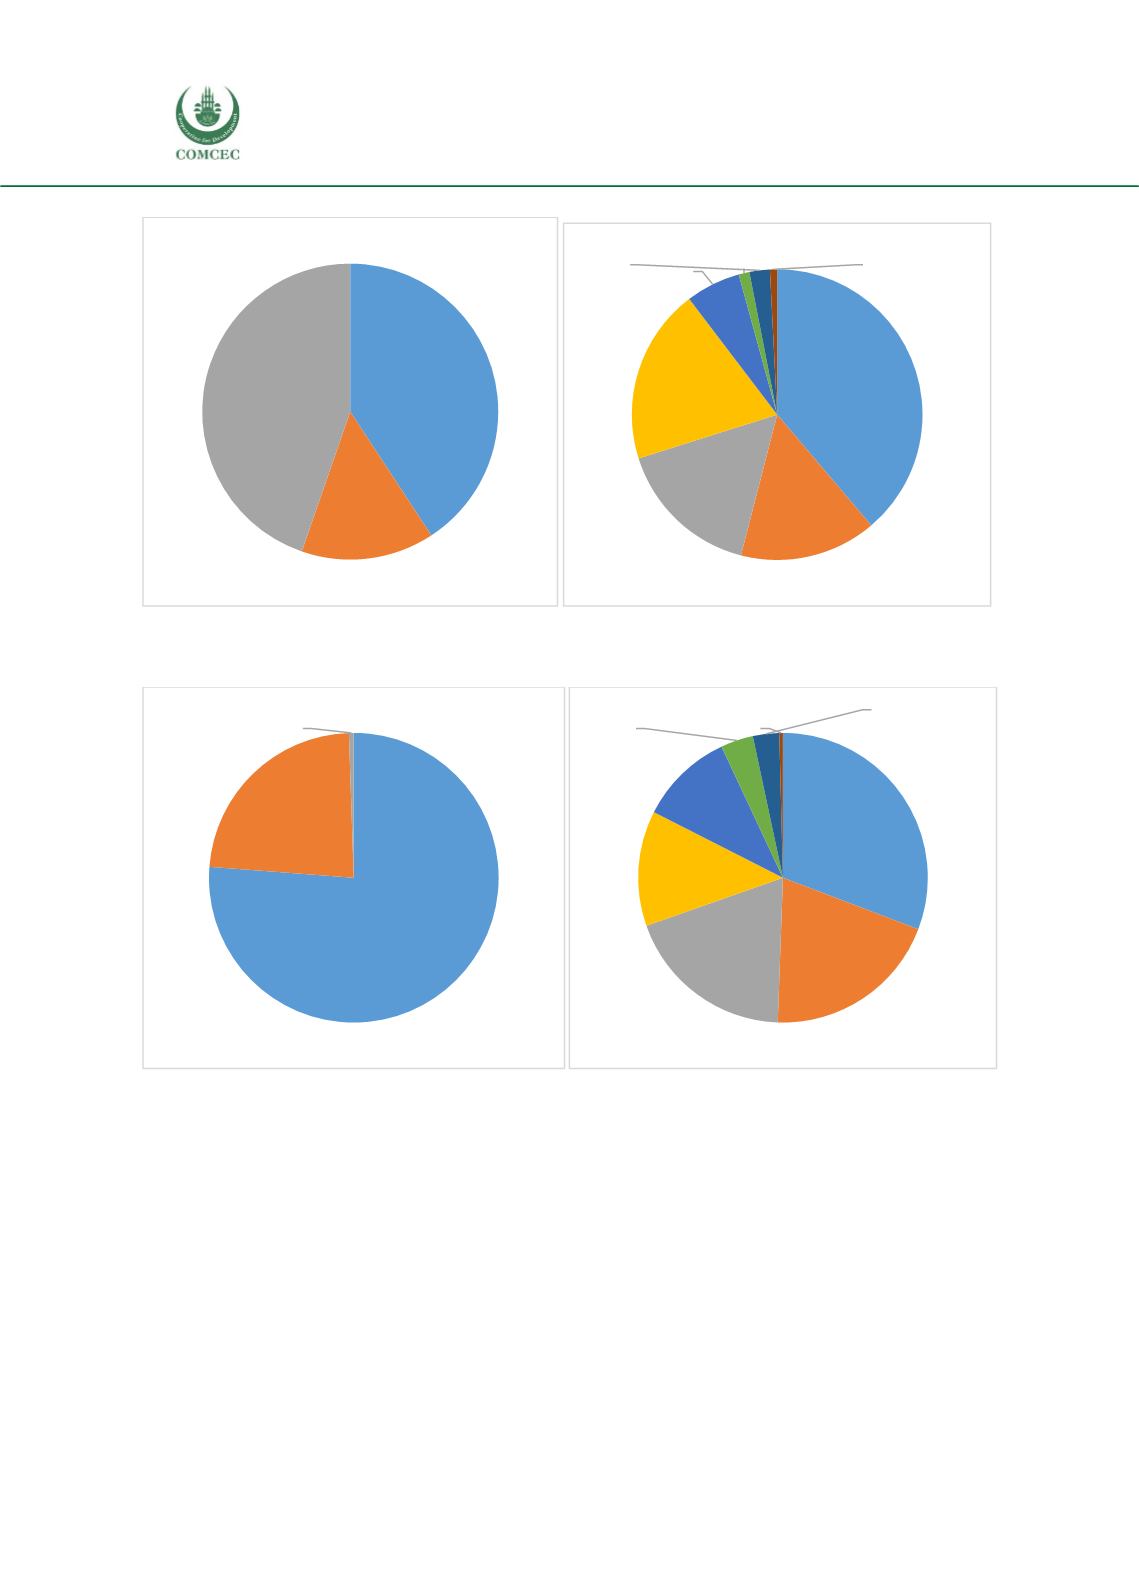
Figure 27: Product Composition and Direction of Agricultural Exports, 2015, Percent
Source: UN Comtrade retrieved through WITS.
Figure 28: Product Composition and Direction of Agricultural Imports, 2015, Percent
Source: UN Comtrade retrieved through WITS.
Export of Agricultural Products
Composition and patterns of Agricultural Exports
Bangladesh’s Agricultural exports increased from 707.68 million USD in 2005 to more than 1
billion USD in 2015, at an average annual growth rate of 4%. However, the country’s agricultural
export shows an uneven growth trend. While the export sector grew positively up to 2007, faced
steep contraction in 2008 and 2009, probably due to the shirking global demand following the
global financial crisis. Then it jumped again in 2010 registering a huge 43 % growth, while
Agri-
Food
Products
41%
Agricultural
Raw
Materials
14%
Fish
Products
45%
Europe &
Central
Asia
39%
South
Asia
15%
East Asia
& Pacific
16%
Middle
East &
North
Africa
20%
North
America
6%
Others
1%
Sub-
Saharan
Africa
2%
Latin
America &
Caribbean
1%
Agri-Food
Products
76%
Agricultur
al Raw
Materials
23%
Fish
Products
1%
East Asia
& Pacific
31%
Latin
America &
Caribbean
20%
South
Asia
19%
Europe &
Central
Asia
13%
North
America
10%
Sub-
Saharan
Africa
4%
Middle
East &
North
Africa
3%
Others
0,41%