
Improving Agricultural Market Performance
:
Creation and Development of Market Institutions
114
and commercial ranches in Uganda’s south. The lion’s share of Uganda’s agricultural
production activities are manually done (e.g. cattle-driven ox ploughs) and mechanization is
only developing sporadically.
High costs, limited availability, inadequate, and unequal access to finance and insurance
continues to constrain small-scale farmers to invest in their assets, upgrade their production
capacities, and support them in periods of extreme weather (e.g. droughts or heavy rainfall)
leading to crop failures.
224
Some credit is available but interest rates range from 10 to 20%.
225
Agricultural institutional financing
226
is a critical component missing in Uganda’s agricultural
sector, considerably undermining the efficiency and performance of its market system.
Finally, more adequate facilities are required to facilitate more efficient production, especially
for small-scale subsistence farming.
227
For instance, hatcheries are needed to support fisheries
and the aquaculture industry
228
while water pumps,
229
irrigation, contract farming, and out-
grower schemes,
230
veterinary services and care, farming-related inputs, machinery, and
equipment (e.g. hybrid seeds, animal feeds, livestock genetics, pesticides, and fertilizers)
231
need to become more available for Uganda’s small-scale farmers – particularly in the rural
areas - at lower costs. For example, seeds have to be imported from Kenya, making their
supply unreliable and expensive.
232
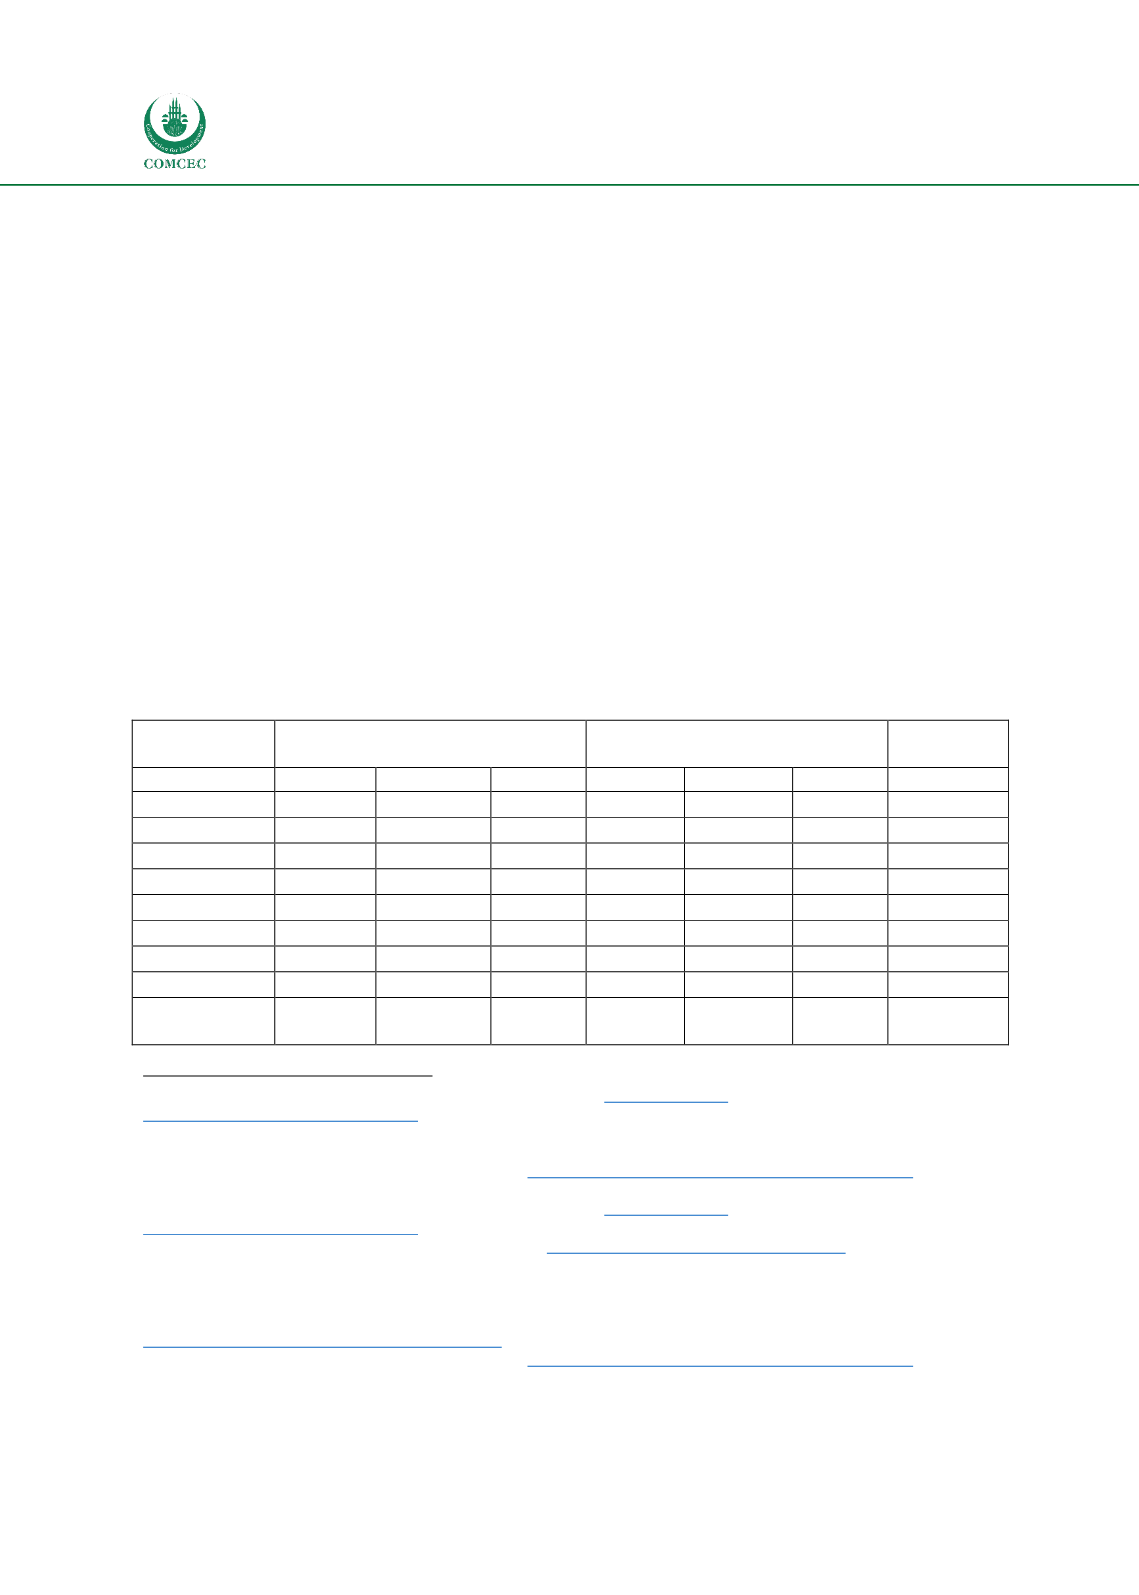
Table 4
–
Uganda (UGA)/World agricultural production and exports, selected commodities
2016 Production (‘000 MT)
2016 Exports (‘000 MT)
Imports
(‘000 MT)
UGA
World
UGA %
UGA
World
UGA %
Sorghum
320
62,640
1%
83
8,709
1%
9.3
Soybeans
30
351,780
0%
10.6
145,170
0%
Bananas**
587
114,130
1%
2.8
21,876
0%
Millet**
237
28,385
1%
/
/
/
Coffee*
3700
159,312
2%
3600
130,326
3%
0
Cassava**
2812
268,278
1%
/
/
/
Maize
1680
1,068,790
0%
225
148,475
0%
1.5
Wheat**
22
729,012
0%
0.4
184,341
0%
562
Beef
&
veal***
162.7
61,583
0%
0.131
9,641
0%
0.034
224
New Agriculturist (2012), Country profile – Uganda, available a
t http://www.new- ag.info/en/country/profile.php?a=2414 [Accessed May 2017].
225
Women in Europe for a Common Future (2014),
Empower Women – Benefit for All: Report
Baseline and Training Needs Assessment – Agriculture for Uganda
, pp. 15-20, Utrecht: WEFC.
226
Export.gov (2016), Uganda - Agriculture, available a
t https://www.export.gov/article?id=Uganda-Agriculture [Accessed
May 2017].
227
New Agriculturist (2012), Country profile – Uganda, available a
t http://www.new- ag.info/en/country/profile.php?a=2414 [Accessed May 2017].
228
Government of Uganda (2017), Agriculture, available a
t http://www.gou.go.ug/content/agriculture [Accessed May
2017].
229
Women in Europe for a Common Future (2014),
Empower Women – Benefit for All: Report
Baseline and Training Needs Assessment – Agriculture for Uganda
, pp. 15-20, Utrecht: WEFC.
230
Government of Uganda (2015), Second National Development Plan (NDPII) 2015/16 – 2019/20, available at
http://npa.ug/wp-content/uploads/NDPII-Final.pdf[Accessed May 2017].
231
Export.gov (2016), Uganda - Agriculture, available a
t https://www.export.gov/article?id=Uganda-Agriculture [Accessed
May 2017].
232
Women in Europe for a Common Future (2014),
Empower Women – Benefit for All: Report
Baseline and Training Needs Assessment – Agriculture for Uganda
, pp. 15-20, Utrecht: WEFC.


