


 37 / 99

28
8.
WATER WITHDRAWAL IN THE COMCEC MEMBER COUNTRIES
Since vast amount of world water resources is used in agriculture and global
food demand is ever-increasing, water resources management through efficient
irrigation systems and water-saving technologies has gained a greater significance
during the last decade.
The efficient use of water resources in agriculture, through improving irrigation
systems and techniques, is one of the most urgent needs and prerequisites for
sustainable agricultural development and food security in these countries, particularly
those in water-scarce regions.
The distribution of water resources within the COMCEC region is far from
being uniform. Land relief, location with respect to the sea, latitude and resultant hydro-
climatic conditions, diversity in hydrographical and geological structures all lead to
extremely different water situations in the COMCEC Member Countries. At the
individual country level, while TRWR per capita is higher than the world average of
8224 m
3
/year in 12 COMCEC countries, 23 COMCEC Countries are suffering from
water stress with TRWR per capita less than 1700 m
3
/year.
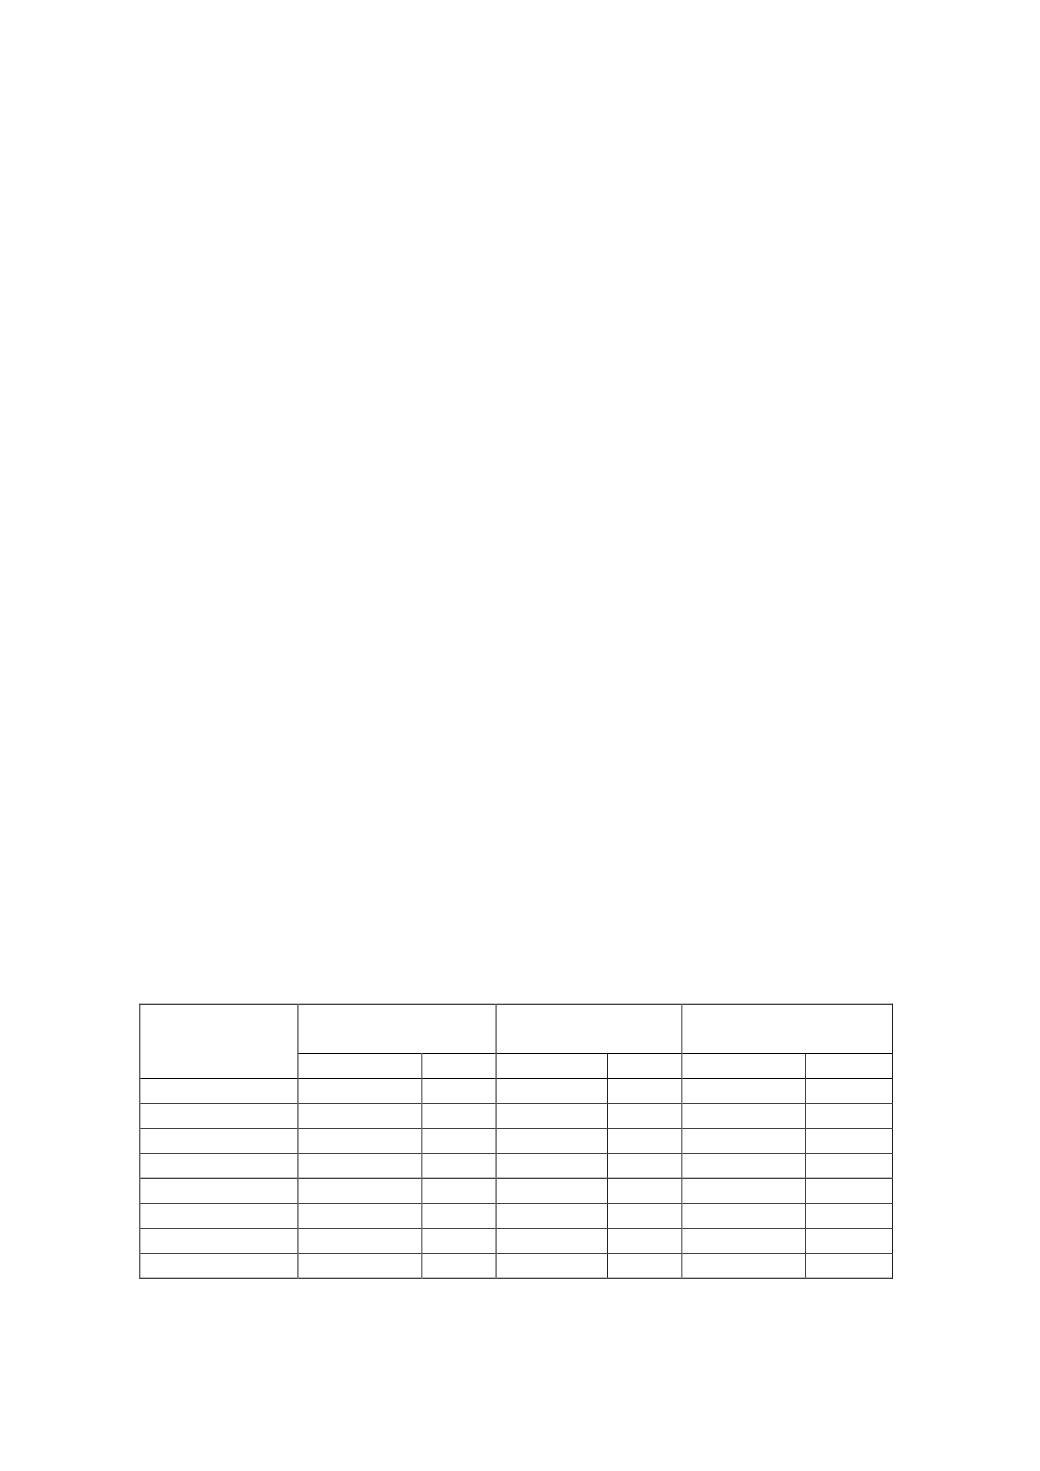
The water withdrawals of different country groups are given in Table 8.1. LDC
countries in Asia and Arab Groups withdraw more than 80% of water for agricultural
irrigations. DEV and OECD countries withdraw more than 40% for industrial uses.
Also in the same countries, more than 15% was withdrawn for domestic (municipal)
uses. Municipal withdrawal is higher than industrial withdrawal in Arab and Asian
countries (Annex 7).
Table 8.1. Sectorial Distribution of Water Withdrawal
Country
Agricultural water
withdrawal
Industrial water
withdrawal
Municipal water
withdrawal
10
9
m
3
/yr
%
10
9
m
3
/yr
%
10
9
m
3
/yr
%
LDC
172.7
90.5
3.5
1.8
14.6
7.7
OECD
436.7
43.6
402.0
40.1
163.5
16.3
DEV
366.4
39.8
398.5
43.2
156.8
17.0
WORLD
9795.4
89.1
731.1
6.7
468.4
4.3
COMCEC
782.9
10.5
69.5
0.9
80.2
1.1
African Group
19.6
0.3
2.9
0.0
7.4
0.1
Arab Group
207.4
84.6
17.4
7.1
21.2
8.6
Asian Group
555.8
87.3
49.2
7.7
51.6
8.1
Source: AQUASTAT, 2013