
Improving Public Debt Management
In the OIC Member Countries
89
reduce domestic debt arrears from around 18% of GDP in 2010 to 11% of GDP in 2014. At the
same time, the amount of outstanding TBills and TBonds doubled from 9.2% of GDP (2010)
to 18.4% of GDP (2014), which are the highest ratios within the WAEMU. Because of the
increasing use of domestic borrowing instruments with shortterm maturities (TBills), Togo’s
rollover and refinancing risks have increased (IMF 2015b).
The government intends to support the expansion of the domestic debt market through (i)
regular and predictable bond emissions; (ii) transparency and adherence to emission
schedules; (iii) regular presence on the market for cash management operations; (iv) almost
exclusive reliance on the issuance of government securities by invitation to tender for the
mobilization of resources programmed in the budget; (v) soliciting individuals, pension funds
and insurance companies in the public securities issuance operations because share of
government securities held by these investors is low and (vi) intensification of actions for
actual operation of the secondary market (MoEF 2016).
Foreign borrowing
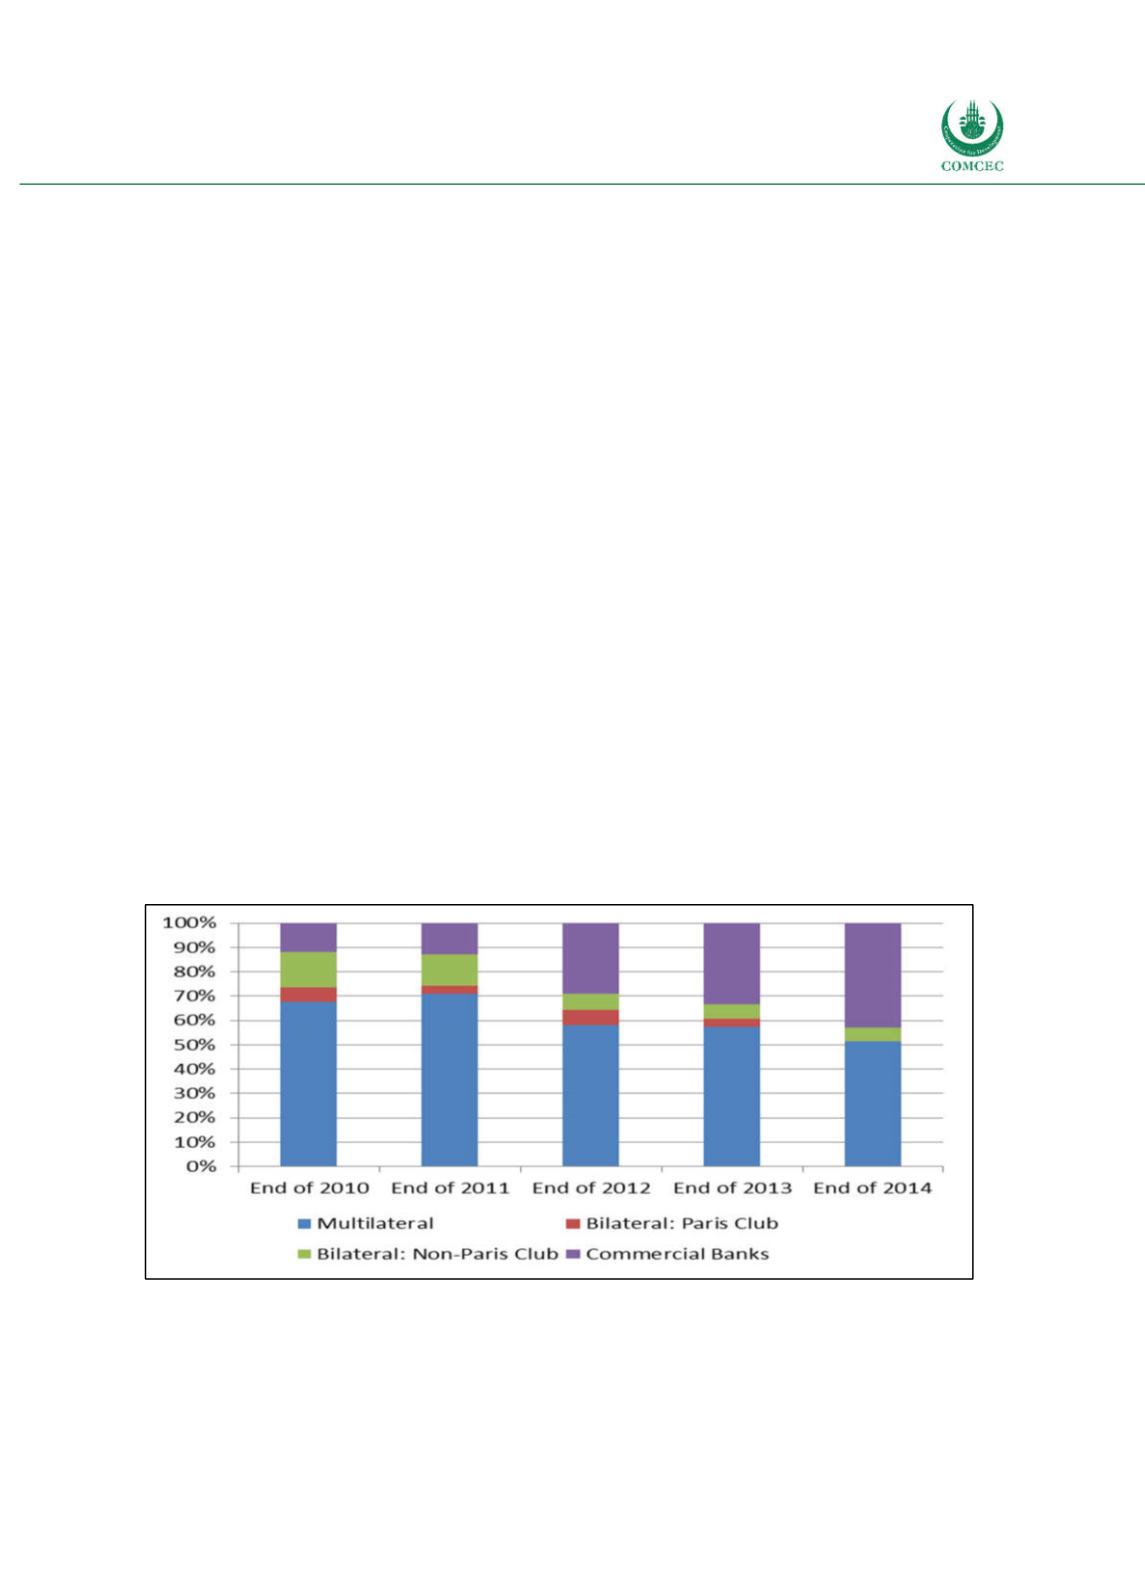
External debt currently represents about 46.9% of total debt. The creditor structure of central
government external debt changed strongly as a consequence of the debt relief. The share of
multilateral external debt decreased from around 68% of total external debt in 2010 to 51% in
2014 (see Figure 49). The share of central government external debt from commercial banks
increased significantly from 11.8% in 2010 to 42.9% in 2014. As loans from commercial banks
are typically contracted at less favorable conditions than loans from official creditors, pressure
on Togo’s external debt has increased (IMF 2015b, 2015c). Through the debt reliefs, both the
share of bilateral debt from ParisClub creditors and from NonParis Club creditors has
decreased significantly. External debt from ParisClub creditors has fully vanished until 2014.
Besides, liabilities of stateowned enterprises, which are not considered in Figure 49,
represent around 11% of the total general government debt.
Figure 4-9: Togo - Creditor Structure of External Public Debt
Sources: IMF (2015c), calculations by the Ifo Institute.
The currency structure of Togo’s external general government debt changed significantly
between 2006 and 2014 (see Figure 47). The share of Dollardenominated debt increased
from 48.9% to 63%. Afterwards, however, the share of Dollardenominated debt declined


