


 38 / 187

Islamic Fund Management
24
US accounted for a respective 55% and 26% of global AuM in 2016. They are followed by the
Asia-Pacific region, with 14% of AuM (PWC, 2017b)
. Chart 2.1indicates the number of Islamic
funds by domicile as at end-2017. Meanwhile
, Chart 2.3shows global AuM by region for the
same period.
Table 2.4: Estimated Global AuM 2004-2020 (USD trillion)
Clients
2004
2007
2012
2013
2014
2015
2020
Mass
Affluent
42.1
55.8
59.5
64.2
67.2
62.5
96.3
HNWIs
37.9
50.1
52.4
59.2
69.6
67.8
83.5
Pension
Funds
21.3
29.4
33.9
35.8
38.7
38.2
55.8
Insurance
Companies
17.7
21.2
24.1
26.1
26.2
27.1
38.8
SWFs
1.9
3.3
5.3
6.1
6.3
6.7
10.0
Total Clients’
Assets
120.9
159.8
175.2
191.4
208.0
202.3
284.4
Global AuM
37.3
59.4
63.9
71.9
78.0
78.7
112.0
Penetration
Rate
30.9%
37.2%
36.5%
37.6%
37.5%
38.9%
39.4%
Source: PWC (2017, p. 5)
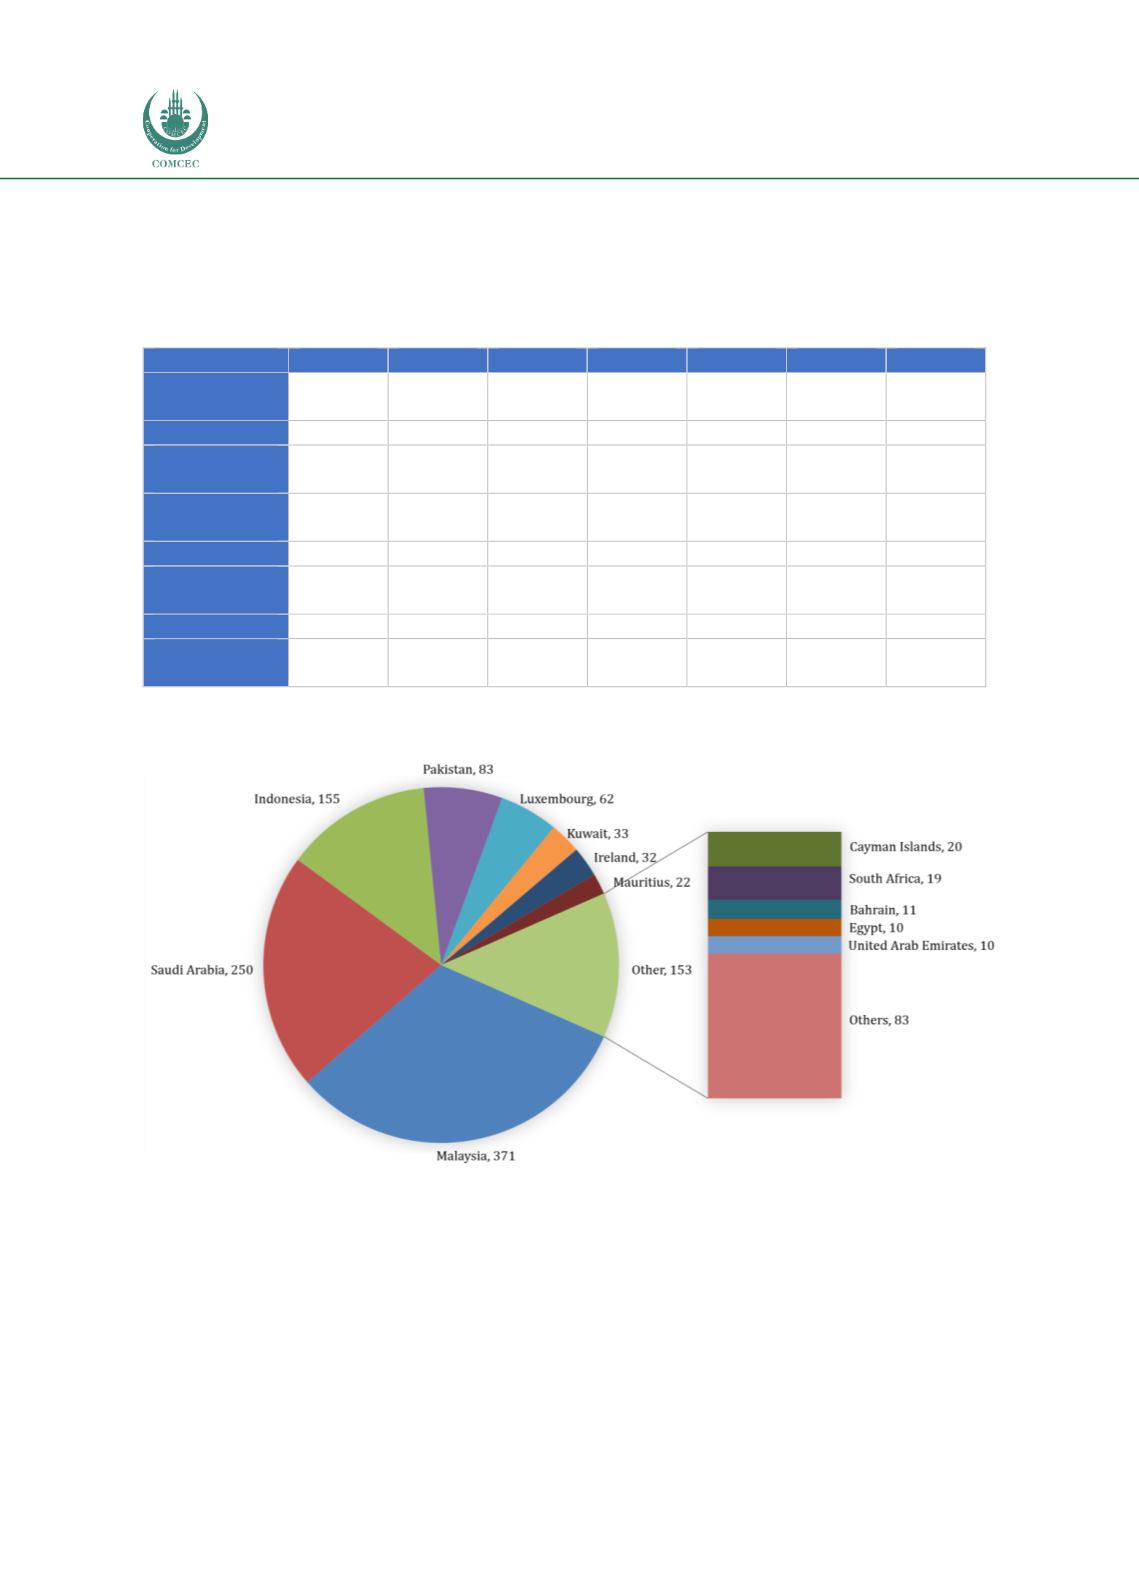
Chart 2.1: Number of Islamic Funds by Domicile (2017)
Sources: IFSB (2018), Bloomberg
The Islamic asset management industry has been posting significant growth since the late
1980s, both in terms of the number of funds and AuM. Reports indicate that the industry
expanded from about 800 Islamic funds in 2008 (IFSB, 2017) to 1,161 as at end-2017,
accounting for some USD66.7 billion of AuM as at end-2017 (IFSB, 2018). Nonetheless, this
sector represents only a small percentage (about 3%) of the total Islamic finance assets of
USD2.05 trillion as at the same date―with the Islamic finance industry being mostly dominated
by the Islamic banking sector (representing 76% or USD1.6 trillion of total assets) and sukuk
(19.5% or USD399.9 billion of total assets).
Chart 2.2 illustrates the breakdown of Islamic