


 131 / 176

Improving Banking Supervisory Mechanisms
In the OIC Member Countries
114
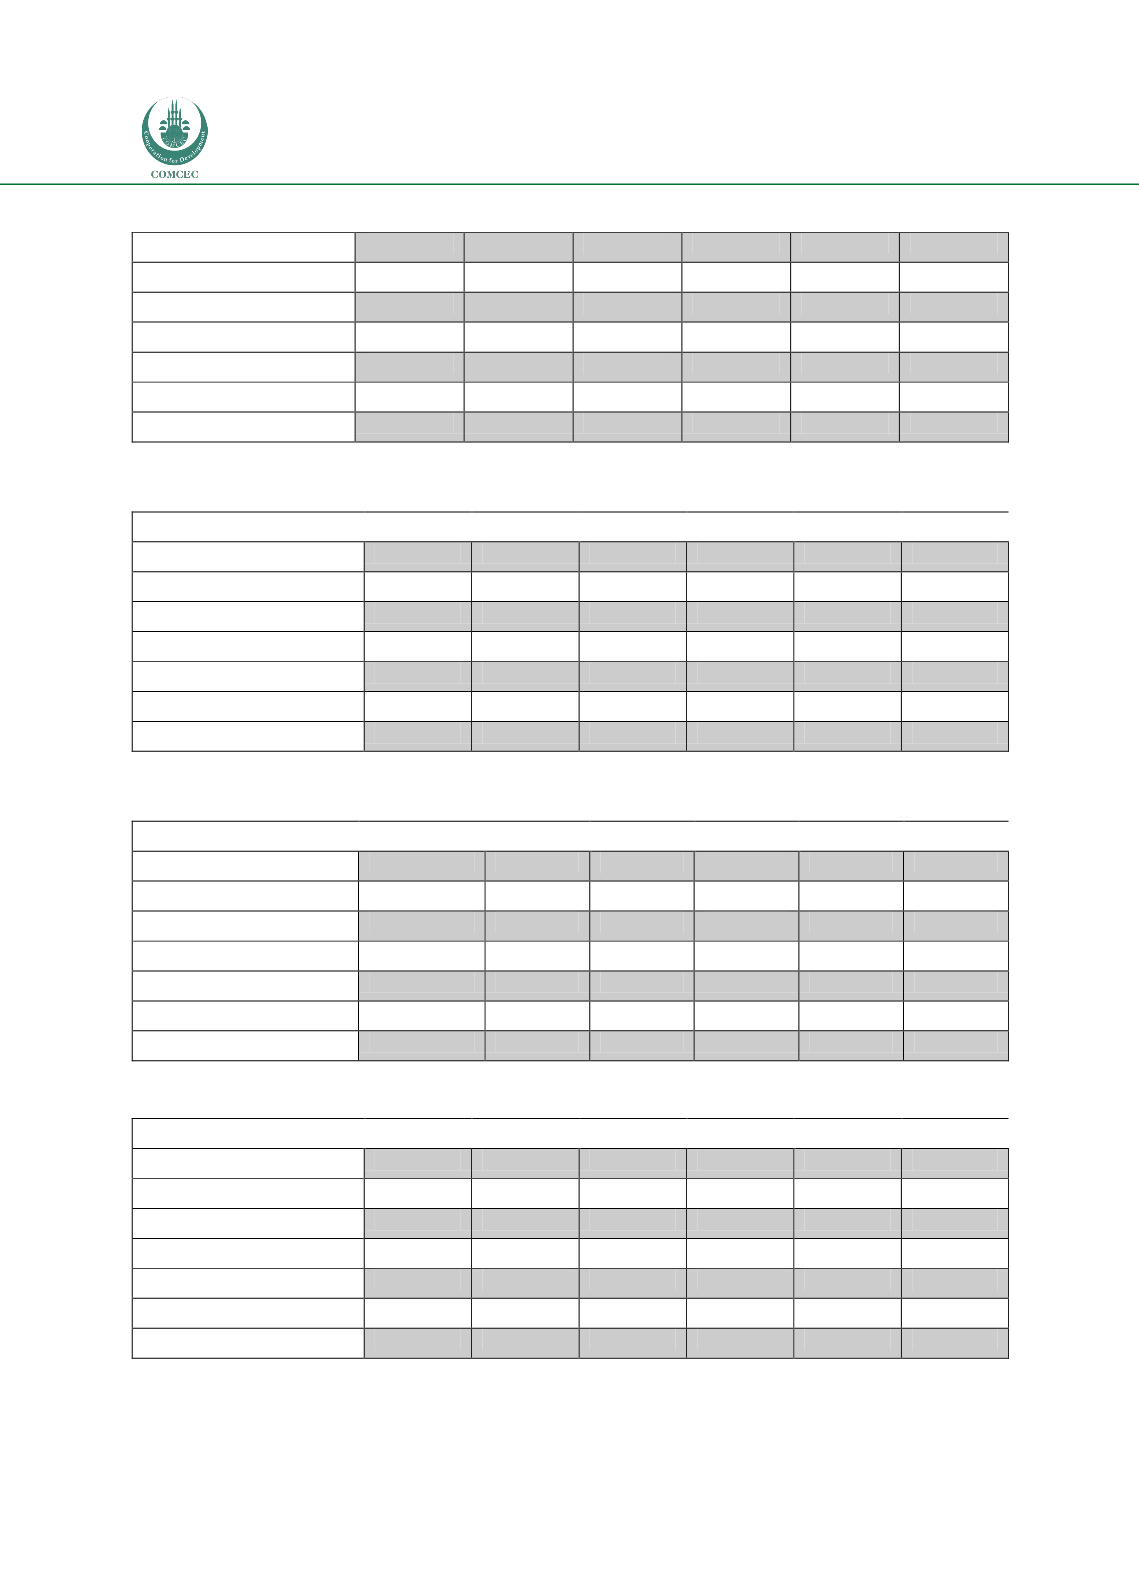
Table 46: Interest Margin to Gross Income
2009
2010
2011
2012
2013
2014
Turkey
69.25
62.49
65.18
64.37
65.37
62.55
Malaysia
57.69
59.82
53.48
54.78
59.60
60.49
Pakistan
72.29
74.64
75.76
71.15
70.33
70.50
Indonesia
62.54
60.48
59.77
64.97
68.84
68.04
Nigeria
59.15
53.57
31.04
61.95
63.94
Kazakhistan
90.81
38.02
69.68
63.81
59.12
68.18
Source: IMF-FSI
Table 47: Liquid Assets to Total Assets
2009
2010
2011
2012
2013
2014
Turkey
57.66
55.44
49.72
50.93
47.14
47.94
Malaysia
14.34
15.71
12.93
13.82
13.16
13.25
Saudi Arabia
25.31
24.75
23.70
23.66
21.56
20.56
Pakistan
31.00
32.30
40.80
44.66
44.56
41.78
Indonesia
28.67
27.22
26.18
25.66
23.50
23.57
Nigeria
10.49
11.98
25.42
24.56
22.03
Kazakhistan
20.22
22.93
22.01
18.61
17.85
21.39
Source: IMF-FSI
Table 48: Non-interest Expenses to Gross Income
2009
2010
2011
2012
2013
2014
Turkey
41.60
46.35
46.51
41.66
51.58
47.25
Malaysia
45.24
41.52
45.25
45.02
42.57
42.20
Saudi Arabia
55.44
52.73
46.89
47.01
47.75
44.10
Pakistan
51.76
53.02
50.84
53.95
57.40
54.62
Indonesia
47.11
49.15
49.00
48.75
49.19
48.60
Nigeria
137.38
50.20
24.37
64.79
68.11
Kazakhistan
42.58
31.21
50.88
45.18
37.24
44.29
Source: IMF-FSI
Table 49: Liquid Assets to Short term Liabilities
2009
2010
2011
2012
2013
2014
Turkey
84.42
79.74
72.02
76.03
72.08
71.84
Malaysia
42.95
48.13
36.58
42.53
40.95
41.38
Saudi Arabia
36.48
37.20
37.00
36.38
33.19
31.86
Pakistan
42.24
46.65
70.66
75.93
85.42
84.12
Indonesia
33.87
32.09
31.21
36.44
30.54
34.27
Nigeria
13.62
13.30
30.12
28.41
25.24
Kazakhistan
64.10
67.52
59.39
50.28
51.05
55.77
Source: IMF-FSI