


 12 / 64

COMCEC Poverty Outlook 2016:
Human Development in OIC
4
1.1.2.
Non-Monetary Poverty
Human Development Index
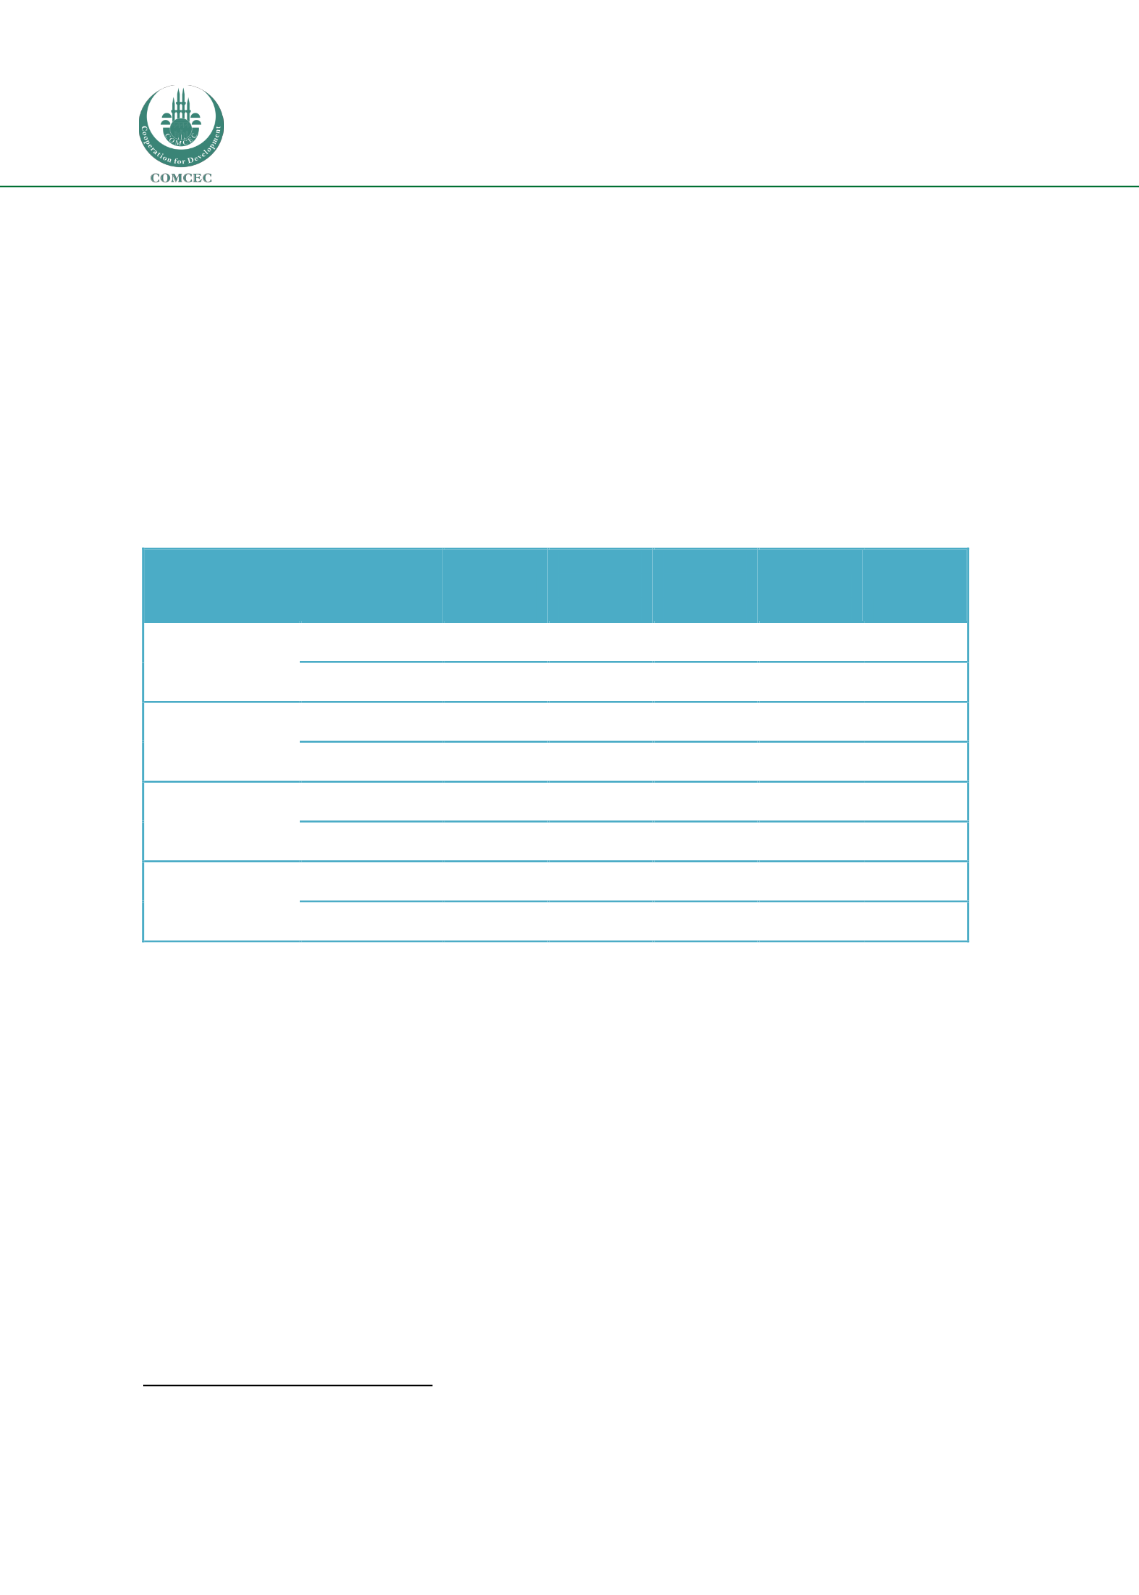
Observing the human development categories and the income levels of the countries together,
it is seen that for most of the cases the income level of a country is in parallel with its human
development category. Indeed, as seen in the Table 1, 98 percent of the countries that is in
‘very high human development category’ have high income levels. On the other hand, 64
percent of the countries that is in ‘low human development category’ have low income levels,
while 32 percent of the countries in the same category have lower-middle income and 2.3
percent has upper-middle income
7
.
Table 1: Income Levels of the Different Types of Human Development Countries
Low
income
Lower-
middle
income
Upper-
middle
income
High
income
Total
Low human
development
# of countries
28
14
1
1
44
%
63.6%
31.8%
2.3%
2.3%
100.0%
Medium
human
development
# of countries
0
30
9
0
39
%
0.0%
76.9%
23.1%
0.0%
100.0%
High human
development
# of countries
0
7
41
8
56
%
0.0%
12.5%
73.2%
14.3%
100.0%
Very high
human
development
# of countries
0
0
1
48
49
%
0.0%
0.0%
2.0%
98.0%
100.0%
Source: Own calculations from
UNDP (2015)
.
Multidimensional Poverty Index
Among the countries for which multidimensional poverty index is calculated; 2 percent is high
income, 29 percent is upper-middle, 40 percent is lower-middle and 29 percent is low income
countries
(Figure 3). The MPI value ranges from 0.001 (Ukraine) to 0.584 (Niger).
7
See Annex 5 for the full list related to the HDI values of the countries
.