


 11 / 64

COMCEC Poverty Outlook 2016:
Human Development in OIC
3
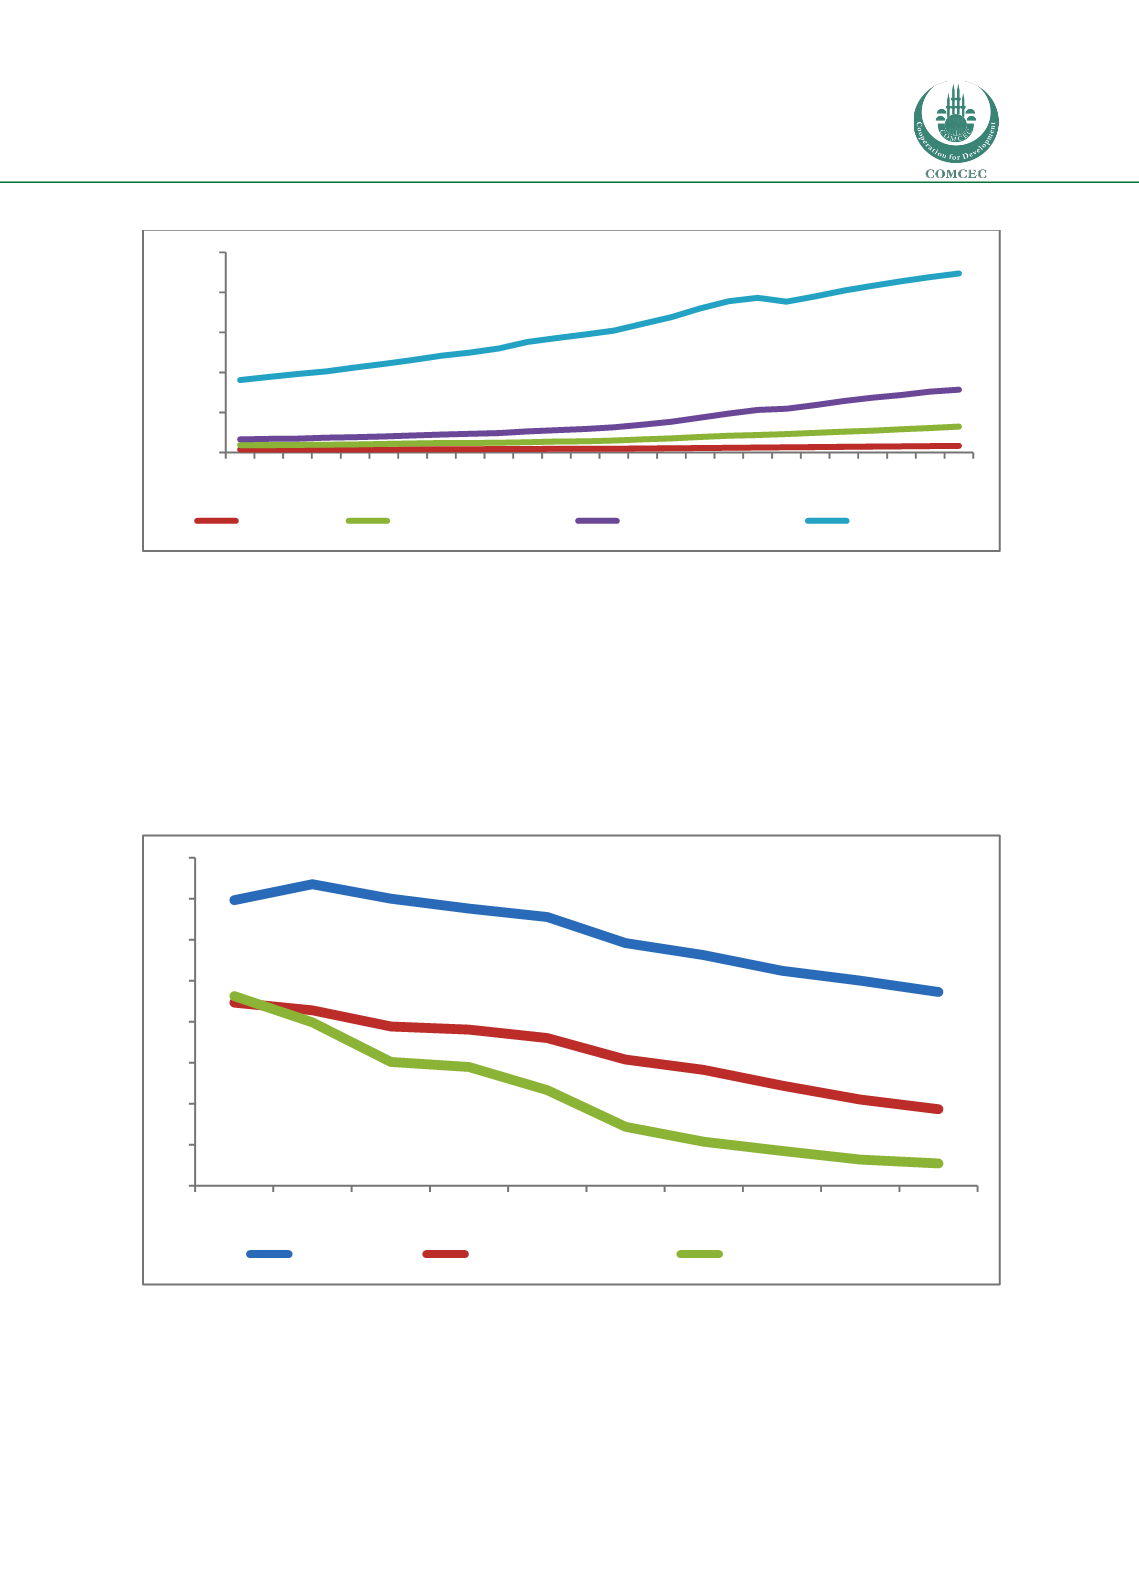
Figure 1: GDP Per Capita (PPP) (Current International $)
Source: : Own calculations from World Development Indicators of the World Bank
For most of the countries, poverty levels decreased in monetary terms for the last three
decades. Indeed, for the period 1981-2010 a significant progress is observed on the ratio of the
people who live under US$1.25. While, this ratio was 40.2 percent for upper-middle income
countries, 47.1 percent for lower-middle income countries and 66 percent for low income
countries in 1990, these ratios fell to 5.4 percent, 22 percent and 46.8 percent respectively for
the so-called income groups in 2011
(Figure 2).
Figure 2: Poverty Headcount Ratio at US$1.90 a day (PPP) (% of Population)
Source: Own calculation, from World Development Indicators of the World Bank
Despite a sustained acceleration on the income levels of the countries, some countries cannot
benefit from that acceleration. To understand the extent of this disparity, non-monetary
indicators of poverty are needed to be examined.
0
10000
20000
30000
40000
50000
1990
1995
2000
2005
2010
2015
Low income
Lower middle income
Upper middle income
High income
0
10
20
30
40
50
60
70
80
1990 1993 1996 1999 2002 2005 2008 2010 2011 2012
Low income
Lower middle income
Upper middle income