


 49 / 62

COMCEC Poverty Outlook 2019
41
different dimension that consists of six indicators related to basic living standards. On the other
hand, income is not included in the calculation of MPI.
Deprivation in education is examined by years of schooling and child school attendance,
deprivation in health is measured by child mortality and nutrition, and deprivation in living
conditions is measured by electricity, improved sanitation, drinking water, flooring, cooking fuel,
and asset ownership.
Because each main dimension is equally weighted in calculation of the index, one dimension
affects the index 33 percent at most. Also each component of dimensions has equal weight. MPI
has maximum and minimum scores for its three dimensions and the related indicators, which
demonstrates for a household a maximum deprivation value of 10 and a minimum value of zero.
A household having a deprivation value of 3 and more is considered as living under
multidimensional poverty, and one who has a value between 2 and 3 is
recognized as being under
the risk of multidimensional poverty. (The UNDP, 2010b:215-222).
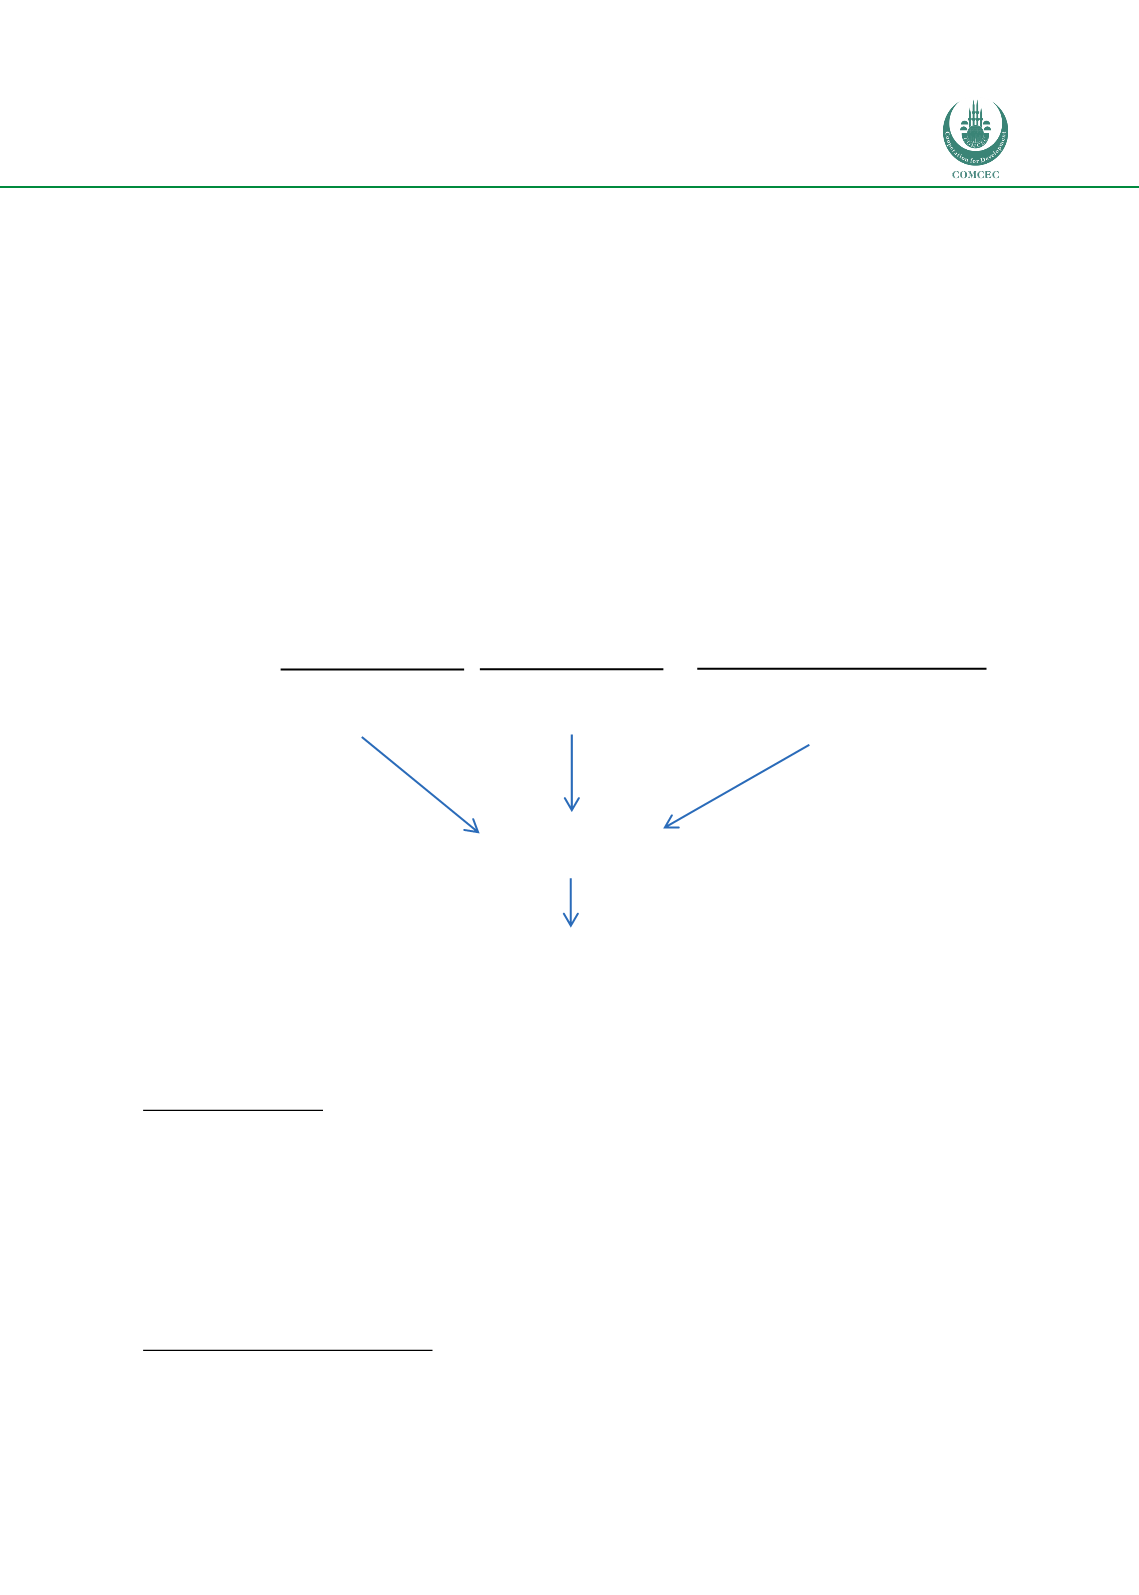
Figure 26: Dimensions of the MPI
DIMENSIONS
Health
Education
Standard of living
INDICATORS
Nutrition
Child
Mortality
Years of
schooling
Children
enrolled
Cooking fuel Toilet Water Electricity
Floor Assets
POVERTY
MEASURES
Intensity of
poverty
Headcount
ratio
Multidimensional Poverty
Index (MPI)
Source: The UNDP, 2015.
Global Hunger Index
Global Hunger Index (GHI) which is calculated by the International Food Policy Research Institute
(IFPRI) is a significant indicator that reveals the state of hunger for countries. The GHI displays
the level of hunger by taking undernourishment
28
, child wasting, child stunting and under-five
mortality rate into account. The methodology of GHI is revised in 2015 report. According to this
new methodology, GHI scores on a 100-point scale where 0 is the best score (no hunger) and 100
the worst. In practice, neither of these extremes can be attained. . A value of 100 means that the
country’ undernourishment, child wasting, child stunting and child mortality levels are the same
28
“Undernourishment” indicates the calorie consumption of fewer than 1,800 a day, which is thought to represent
the minimum calorie requirement that most people need to live a healthy and productive life. (FAO, 2011a quoted
in IFPRI
et.al., 2013:7)