


 31 / 62

COMCEC Poverty Outlook 2019
23
2.
Trends in Human Development in OIC Member States
This section aims to analyze the trends in human development in OIC member states by utilizing
Human Development Reports (HDR) published by UNDP. Human development requires
expanding the richness of human life. This approach focuses on people and their opportunities
and choices rather than economy. Based on this paradigm, UNDP produces HDR’s since 1990 and
the most recent report was published in 2018.
2.1.
International Comparison of Human Development Trends
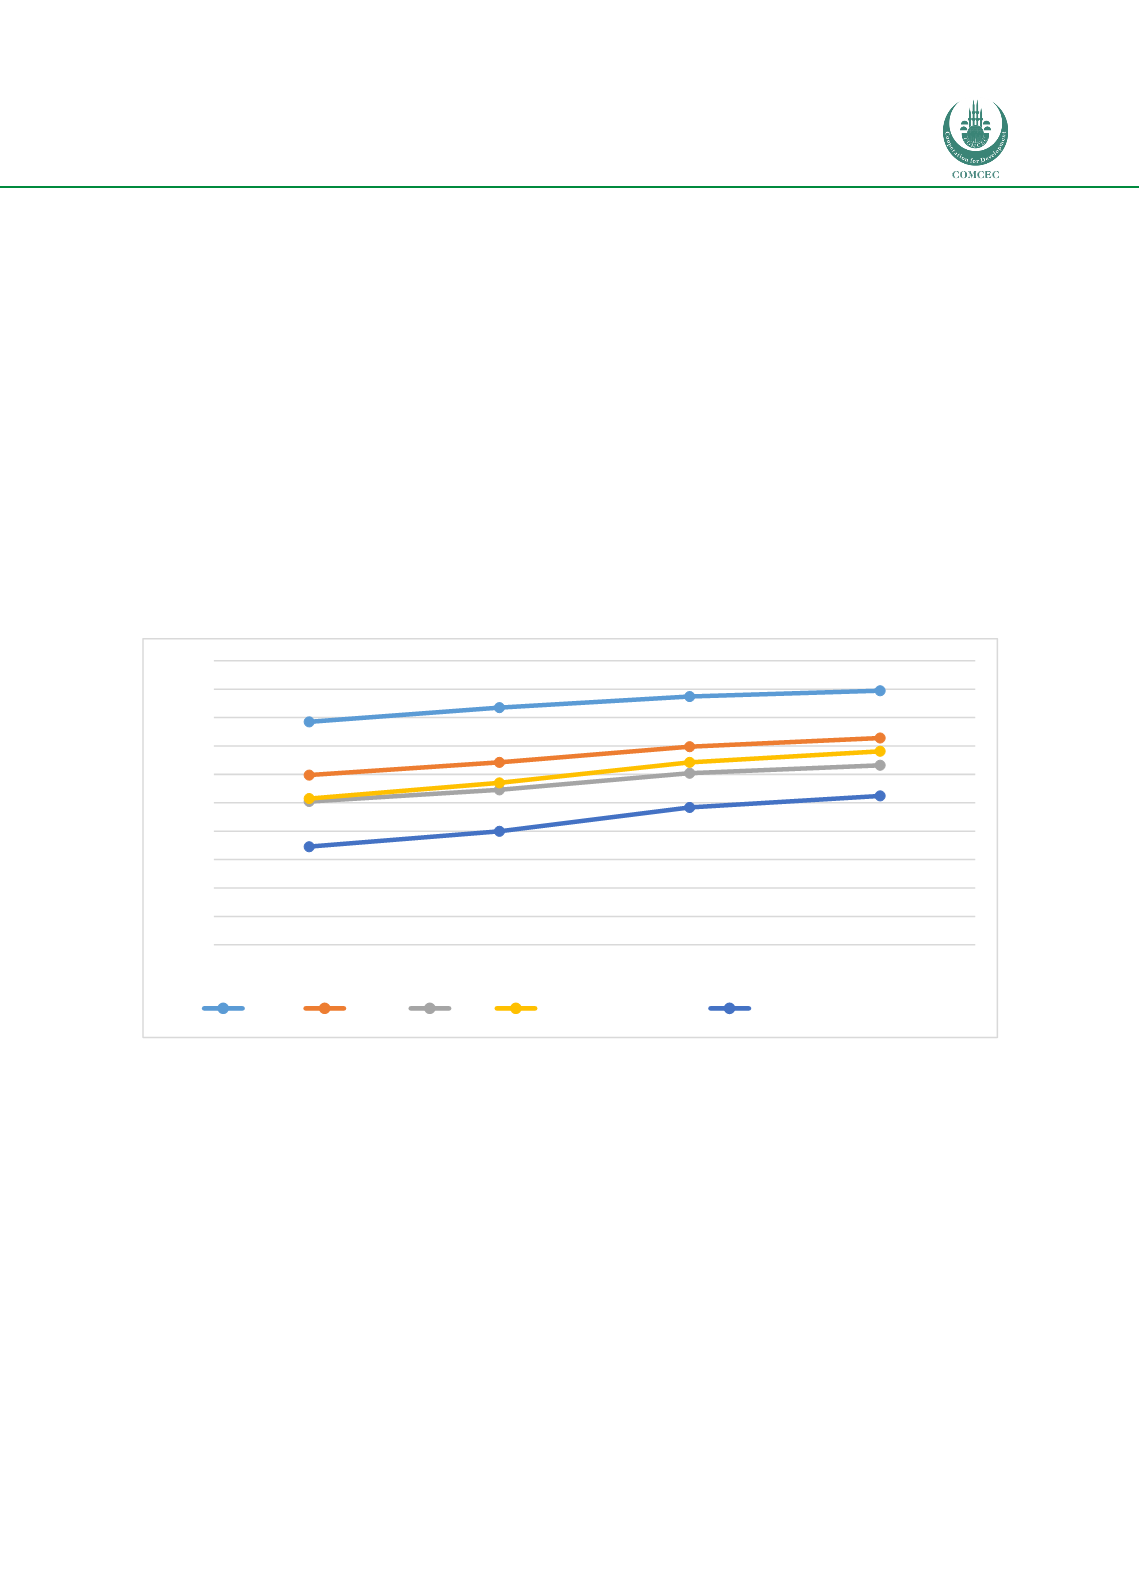
Figure 20 shows the change in human development index (HDI) for selected country groups
between 1990 and 2017. All of the selected groups experienced an increase in this period. The
world average has increased from 0.598 to 0.728. The OIC average rose from 0.505 to 0.632 and
remained significantly below the OECD and world average. OIC’s HDI values are only higher than
those of LDCs. On the other hand, the gap between the OIC and developing countries has enlarged
in the last 27 years. In 1990, it was only 0.010 points whereas it has risen to 0.049 points in 2017
implying a more rapid progress in developing countries.
Figure 20: Trends in Human Development Index, 1990-2017
Source: Own calculations from UNDP (2018).
Note: The averages are unweighted. That is, each country in the groups has the same weight irrespective of its
population.
The annual growth rate in HDI values between 1990 and 2017 are given in Figure 21. Not
surprisingly, the annual growth rate is higher for the groups with lower initial HDI values. During
the period, OIC member states exhibit almost 1.02 percent growth per year. This rate is higher
than that of OECD and world but lower than developing countries and LDCs. The difference
between growth rates of OIC member states and developing countries also explains the widening
gap between the HDI values of these country groups.
0,785
0,835
0,874
0,895
0,598
0,642
0,698
0,728
0,505
0,546
0,604
0,632
0,515
0,570
0,642
0,681
0,346
0,400
0,484
0,524
0,000
0,100
0,200
0,300
0,400
0,500
0,600
0,700
0,800
0,900
1,000
1990
2000
2010
2017
OECD
World
OIC
Developing countries
Least developed countries