


 34 / 59

COMCEC Poverty Outlook 2018
27
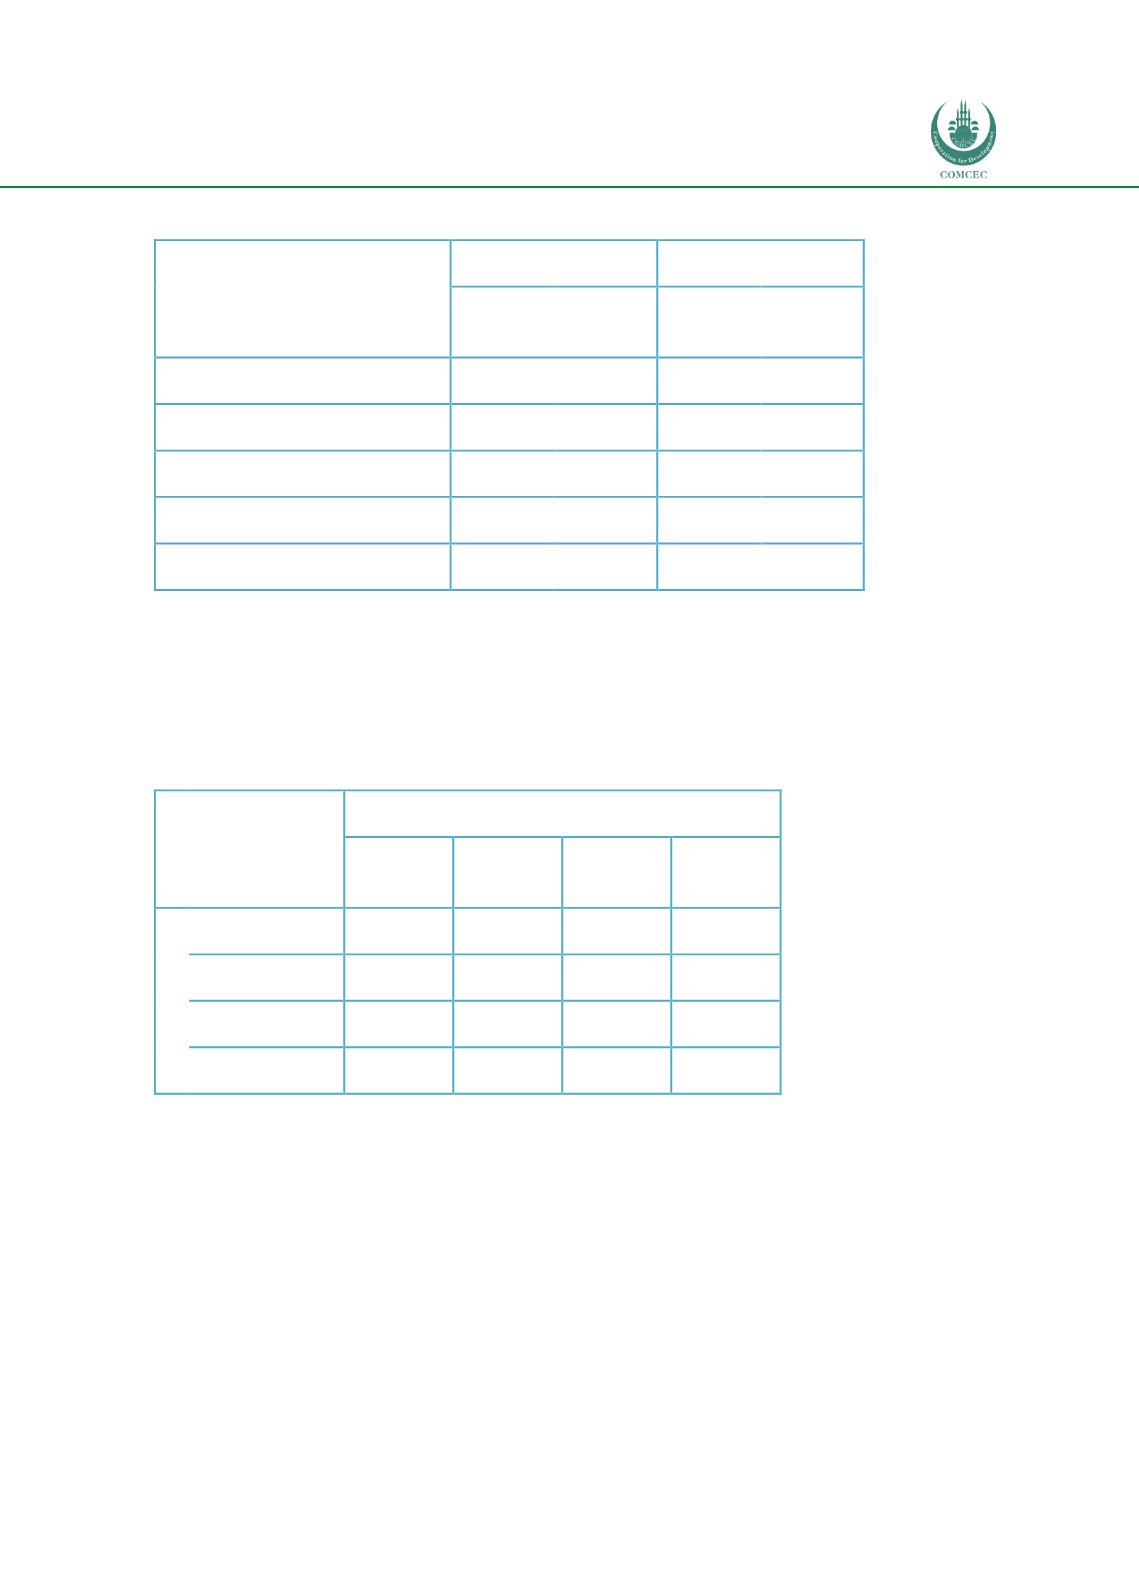
Table 9: OIC Member States by human development level, 2009 and 2016
2009
2016
# of
Countries
%
# of
Countries
%
Low Human Development
14
25
23
41
Medium Human Development
28
51
12
21
High Human Development
9
16
15
27
Very High Human Development
4
7
6
11
Total
55
100
56
100
Source: Own calculations from corresponding years’ HDR.
Note: The methodology of HDI has evolved over time. Therefore, the HDI values and hence categories are not
fully comparable over time.
The transitions between categories from 2016 to 2017 are given i
n Table 10 .Table 10: Transition between development categories from 2016 to 2017
2017
Low HD
Medium
HD
High HD
Very High
HD
2016
Low HD
22
1
0
0
Medium HD
0
10
2
0
High HD
0
0
12
3
Very High HD
0
0
0
6
Source: Own calculations from corresponding years HDR.