
COMCEC Transport and Communications
Outlook 2016
40
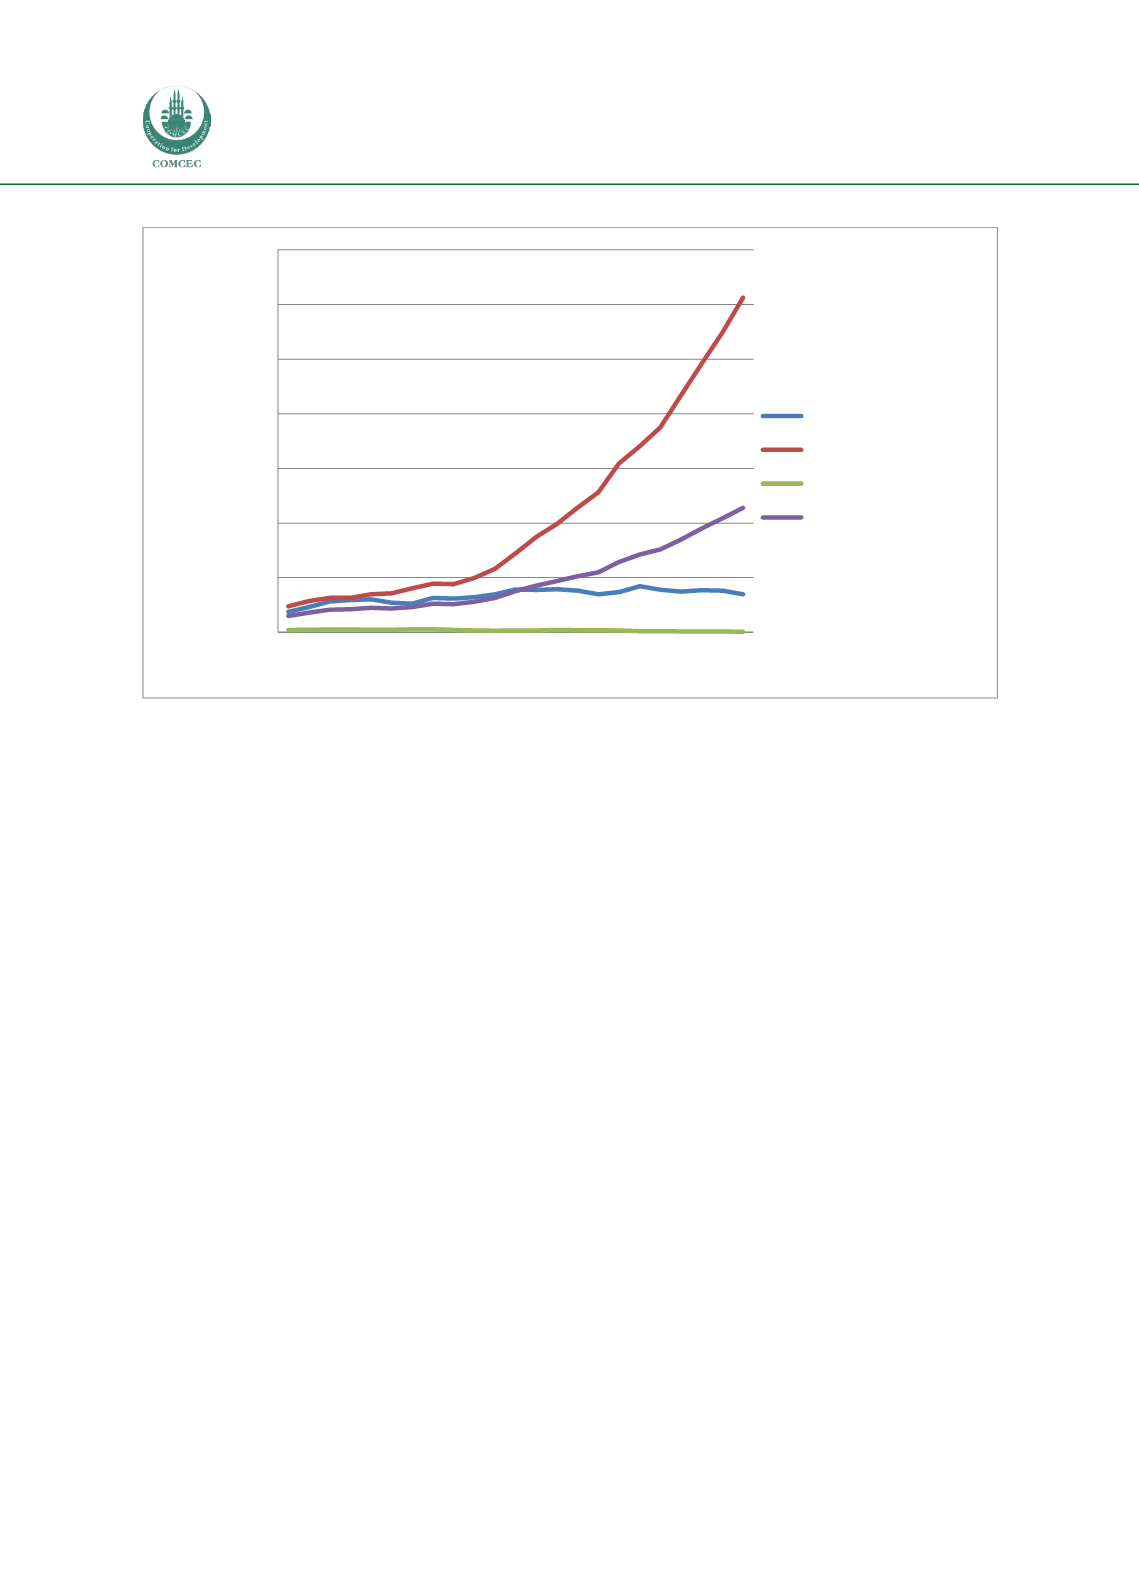
Figure 18: Total air freight carried in the OIC regions (million ton-km) (1993-2015)
Source: Author from the World Bank World Development Indicators, adjusted for missing data
-
5,000
10,000
15,000
20,000
25,000
30,000
35,000
1993
1995
1997
1999
2001
2003
2005
2007
2009
2011
2013
2015
Air Freight Traffic (million ton-km)
OIC-Asia
OIC-MENA
OIC- Sub Saharan Africa
OIC-Average


