
COMCEC Transport and Communications
Outlook 2017
51
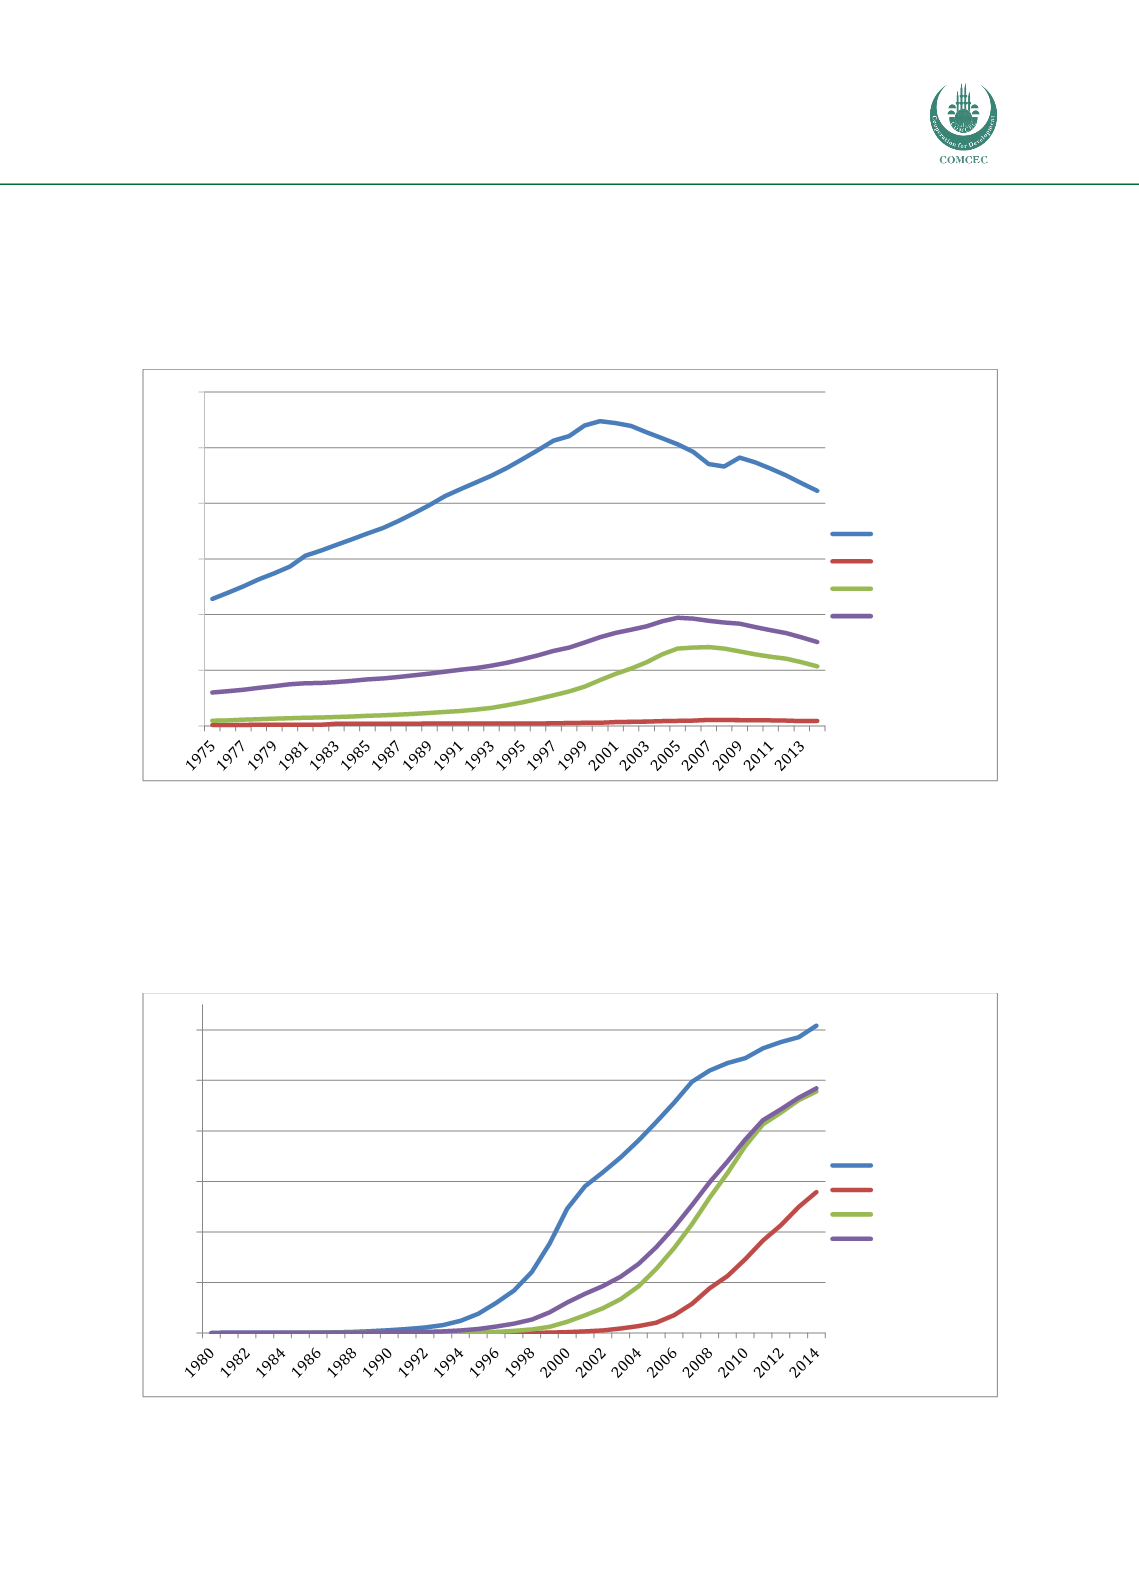
As can be seen in Figure 27, fixed telephone subscriptions per 100 people reached its peak
globally in 2005 with a value close to 20 percent and then it started to decrease rapidly. This
downward trend occurred in all country income groups. While this decrease was observed in
high income countries earlier, others followed later.
Figure 27: Fixed telephone subscriptions (per 100 people) (1975-2013)
Source: World Bank
As seen in Figure 28, as opposed to downward trend in fixed telephony, there is a steep upward
trend in mobile telephony. As of 2014, mobile cellular subscriptions per 100 people were 122,
96 and 56 percent for high, middle and lower income countries respectively.
Figure 28: Mobile cellular subscriptions (per 100 people) (1980-2014)
Source: World Bank
0
10
20
30
40
50
60
High income
Low income
Middle income
World
0
20
40
60
80
100
120
High income
Low income
Middle income
World


