


 17 / 143

COMCEC Transport and Communications
Outlook 2019
9
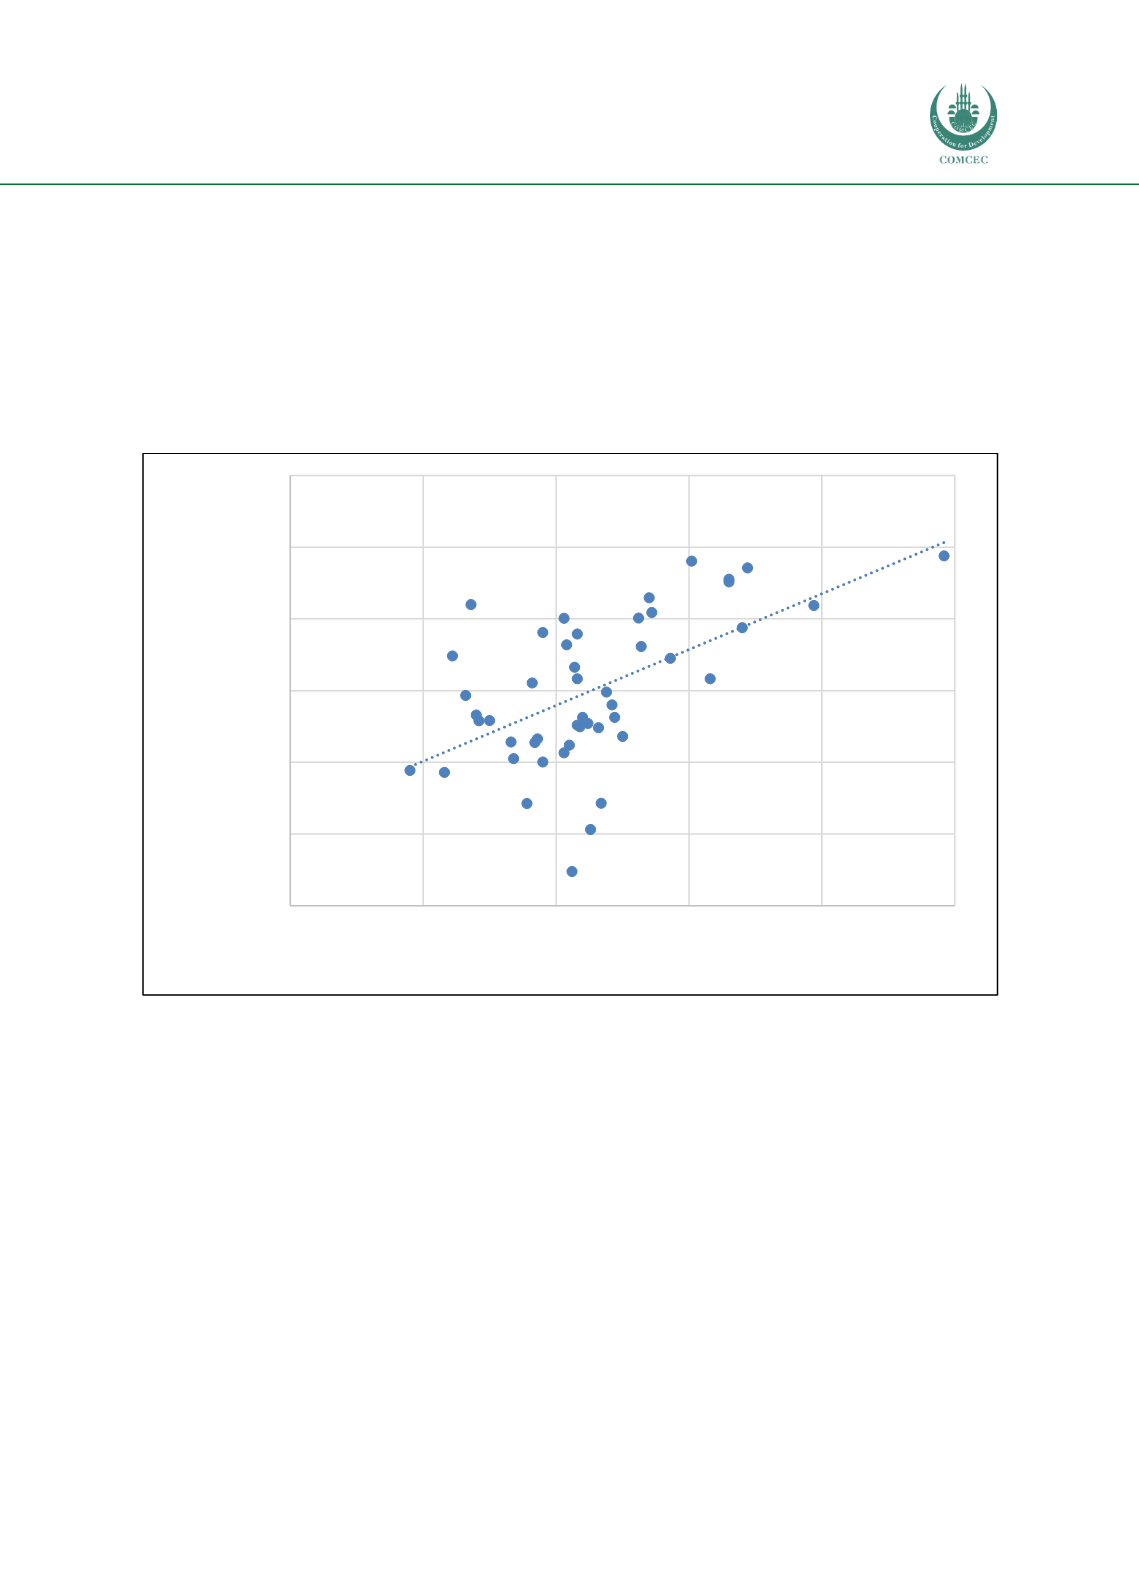
As an evidence of this fact, Figure 1 shows the LPI scores of the OIC countries for the year 2018
and their merchandise exports for the year 2018. The figure reveals that there is a positive
correlation between the LPI scores and merchandise exports of the OIC countries. This might
imply that if an OIC country has a high LPI score this gives it a competitive advantage over those
with lower LPI scores as it can facilitate its exports through its enhanced logistics infrastructure
and services.
Figure 1: Merchandise exports (in million US dollars and natural logarithms) and LPI scores
in OIC countries (2018)
Source: Author from the World Bank World Development Indicators
Figure 2 shows this relation for the 35 OIC countries where the horizontal axis exhibits the 2018
LPI scores and the vertical axis presents their Global Competitiveness Index 4.0 2018 Rankings
published by the World Economic Forum (2018). The figure shows that there is a positive
correlation between the LPI and GCI 4.0 rankings of the OIC countries.
UAE
Qatar
Malaysia
Turkey
Saudi Arabia
3,000
5,000
7,000
9,000
11,000
13,000
15,000
1,500
2,000
2,500
3,000
3,500
4,000
Merchandise exports (LN)
(million US Dollars)
LPI 2018