
COMCEC Tourism Outlook 2017
14
Table 3.3 International Tourism Receipts by Region (Billion $)
Tourism Receipts
2000
2014
2015
2016
Share (%)
World
475
1,252
1,196
1,220
100
Europe
234.5
513.7
449.6
447.3
36.7
Asia & Pacific
86.7
359
349.4
366.7
30.1
Americas
132.8
288.9
305.6
313.2
25.7
Africa
10.8
36.5
32.8
34.8
2.9
Middle East
12.7
53.6
58.2
57.6
4.7
Source: UNWTO, Tourism Highlights 2002&2013&2017 Edition
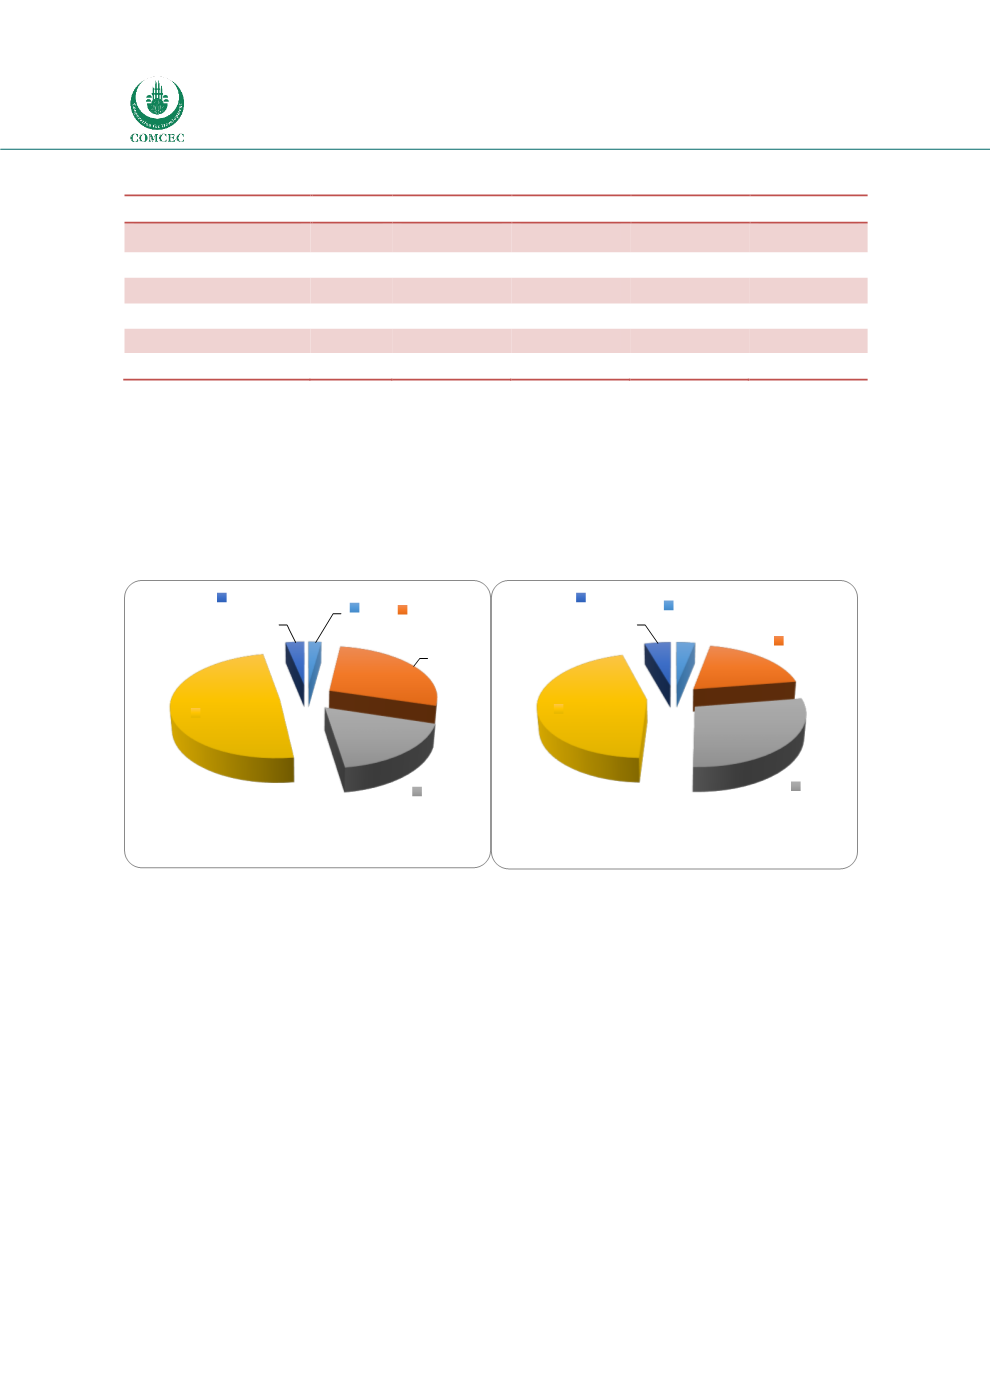
In Europe, international tourism receipts grew by 1% in real terms to US$ 447 billion,
representing 37% of worldwide receipts. Individual destinations had mixed results for 2016
while Iceland, Norway, Ireland, Georgia, Slovakia, Bulgaria, Romania, Lithuania, Portugal, Spain,
Cyprus and Malta reported double digit growth some important destinations such Turkey,
France and Belgium recorded declines, because of terrorist attacks and security concerns.
Figure 3.6 Tourism Receipts by Region (2000-2016)
Source: UNWTO, Tourism Highlights 2013 & 2017 Edition
Accounting for 30% of international receipts, in 2016, Asia-Pacific region earned US$ 367 billion
in international tourism receipts, this means an increase of 5% in real terms compared to 2015.
Korea, Japan, Macau, Vietnam, Indonesia, Philippines, Australia, New Zealand, India, Nepal and
Sri Lanka reported double digit growth in receipts in 2016.
According to the UNWTO (2017a); Americas, accounts for 26% of international tourism receipts
worldwide, and increased its tourism receipts by 3% in real terms to US$313 billion. Canada,
Chile, Colombia, Cuba, Costa Rica and Uruguay enjoyed double digit growths in receipts. USA,
Ecuador, Panama and Aruba recorded slight declines in 2016.
In 2016, parallel to its growth in arrivals Africa experienced a strong rebound in receipts as well.
Receiving 35 billion USD in 2016 the region enjoyed an increase of 8% in real terms compared
to 2015. South Africa, Kenya, Madagascar, Cabo Verde, Mauritius, Seychelles all enjoyed double
digit growth in receipts in 2016.
Africa
2%
America
s
28%
Asia/
Pacific
18%
Europe
49%
Middle
East
3%
2000
Africa
3%
America
s
26%
Asia/
Pacific
30%
Europe
37%
Middle
East
5%
2016


