


 48 / 133

40
Trade Facilitation:
Trade facilitation is defined by UNECE as “the simplification,
standardization and harmonization of procedures and associated
information flows required to move goods from seller to buyer and
to make payment”.
23
Trade Facilitation aims at easing the trade
among the countries through decreasing the burden of procedures
and trade costs. Firms face various costs when trading internationally including export and
import procedures, customs formalities, transportation and logistics problems that trade costs.
WTO notes that trade costs can reach 134 per cent ad valorem tariff equivalent on a product in
high-income countries whereas they can be 219 per cent tariff equivalent in developing
countries.
24
Studies, such as WTO (2004) and De (2009) suggest that higher transport costs is in many cases
more restrictive to trade than high tariffs. Various studies have been conducted to measure the
impact of transport constraints on international trade. For example, based on their research on
Middle East and North Africa (MENA) region, Bhattacharya and Hirut (2010) suggest that
reducing the transport constraint from the average in the region to the world average could have
a significant impact on trade volumes, raising exports by 9.5 percent and imports by 11.5
percent, while all other determinants are constant (ceteris paribus).
There are several indices or reports developed by the international institutions to identify the
bottlenecks in countries which hinder international trade. The World Bank Doing Business
Report is one of these reports. World Bank introduced a new methodology for measuring ease
of trading across borders in 2015. Trading across borders, measures the time and cost
(excluding tariffs) for documentary compliance and border compliance within the overall
process of exporting and importing a shipment of goods.
25
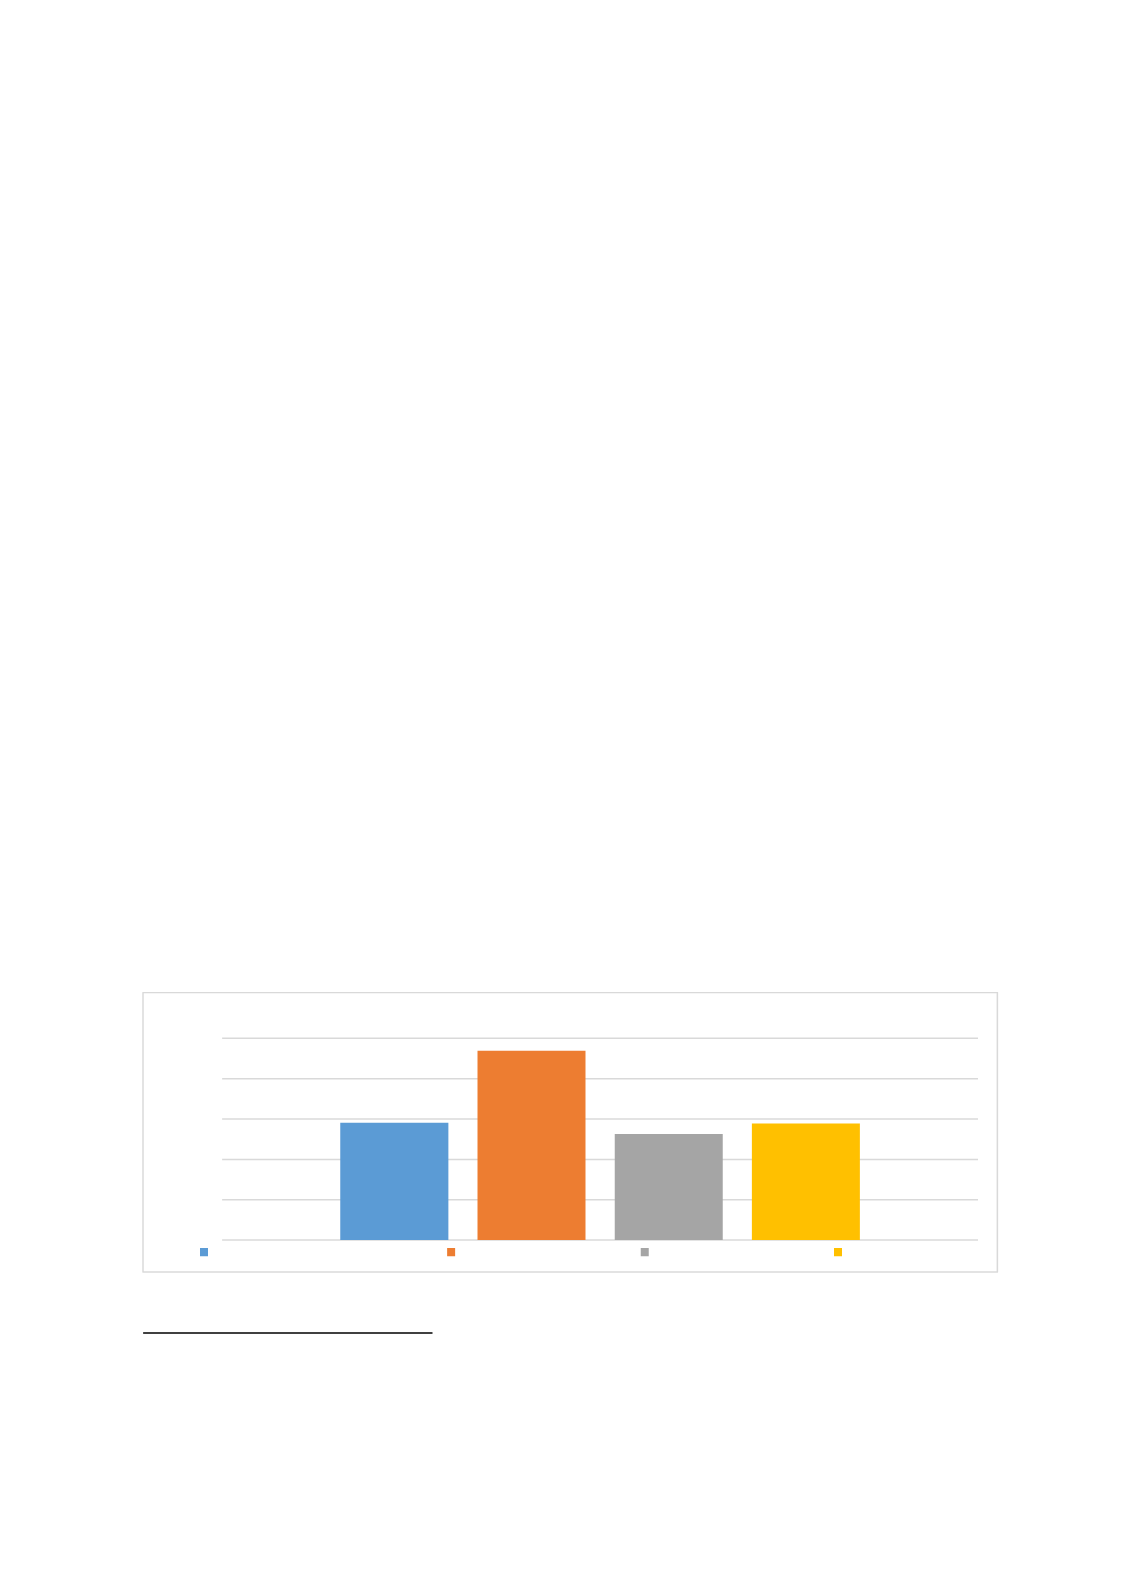
The distance to frontier (DTF) score
shows how far on average an economy is from the best performance achieved by any economy
on Trading Across Borders indicator. Figure 51 below shows the DTF scores for OIC compared
to other regions. OECD high income countries are very close to the frontier while OIC countries
are slightly above 50 per cent. This underlies the importance of policies to facilitate trade in the
OIC countries.
Figure 51: Comparative DTF Scores
Source: Authors’ calculation based on WB Doing Business data
23
http://tfig.unece.org/details.html24
https://www.wto.org/english/tratop_e/tradfa_e/tradfa_introduction_e.htm25
For detailed information on the methodology please visit World Bank
http://www.doingbusiness.org/methodology/trading-across-borders0
20
40
60
80
100
Distance to frontier score
Trading Across Borders - Distance to Frontier
Middle East & North Africa
OECD high income
Sub-Saharan Africa
OIC Average
“Trade Costs are
higher in Landlocked
Member States”