


 45 / 133

COMCEC Trade Outlook 2018
37
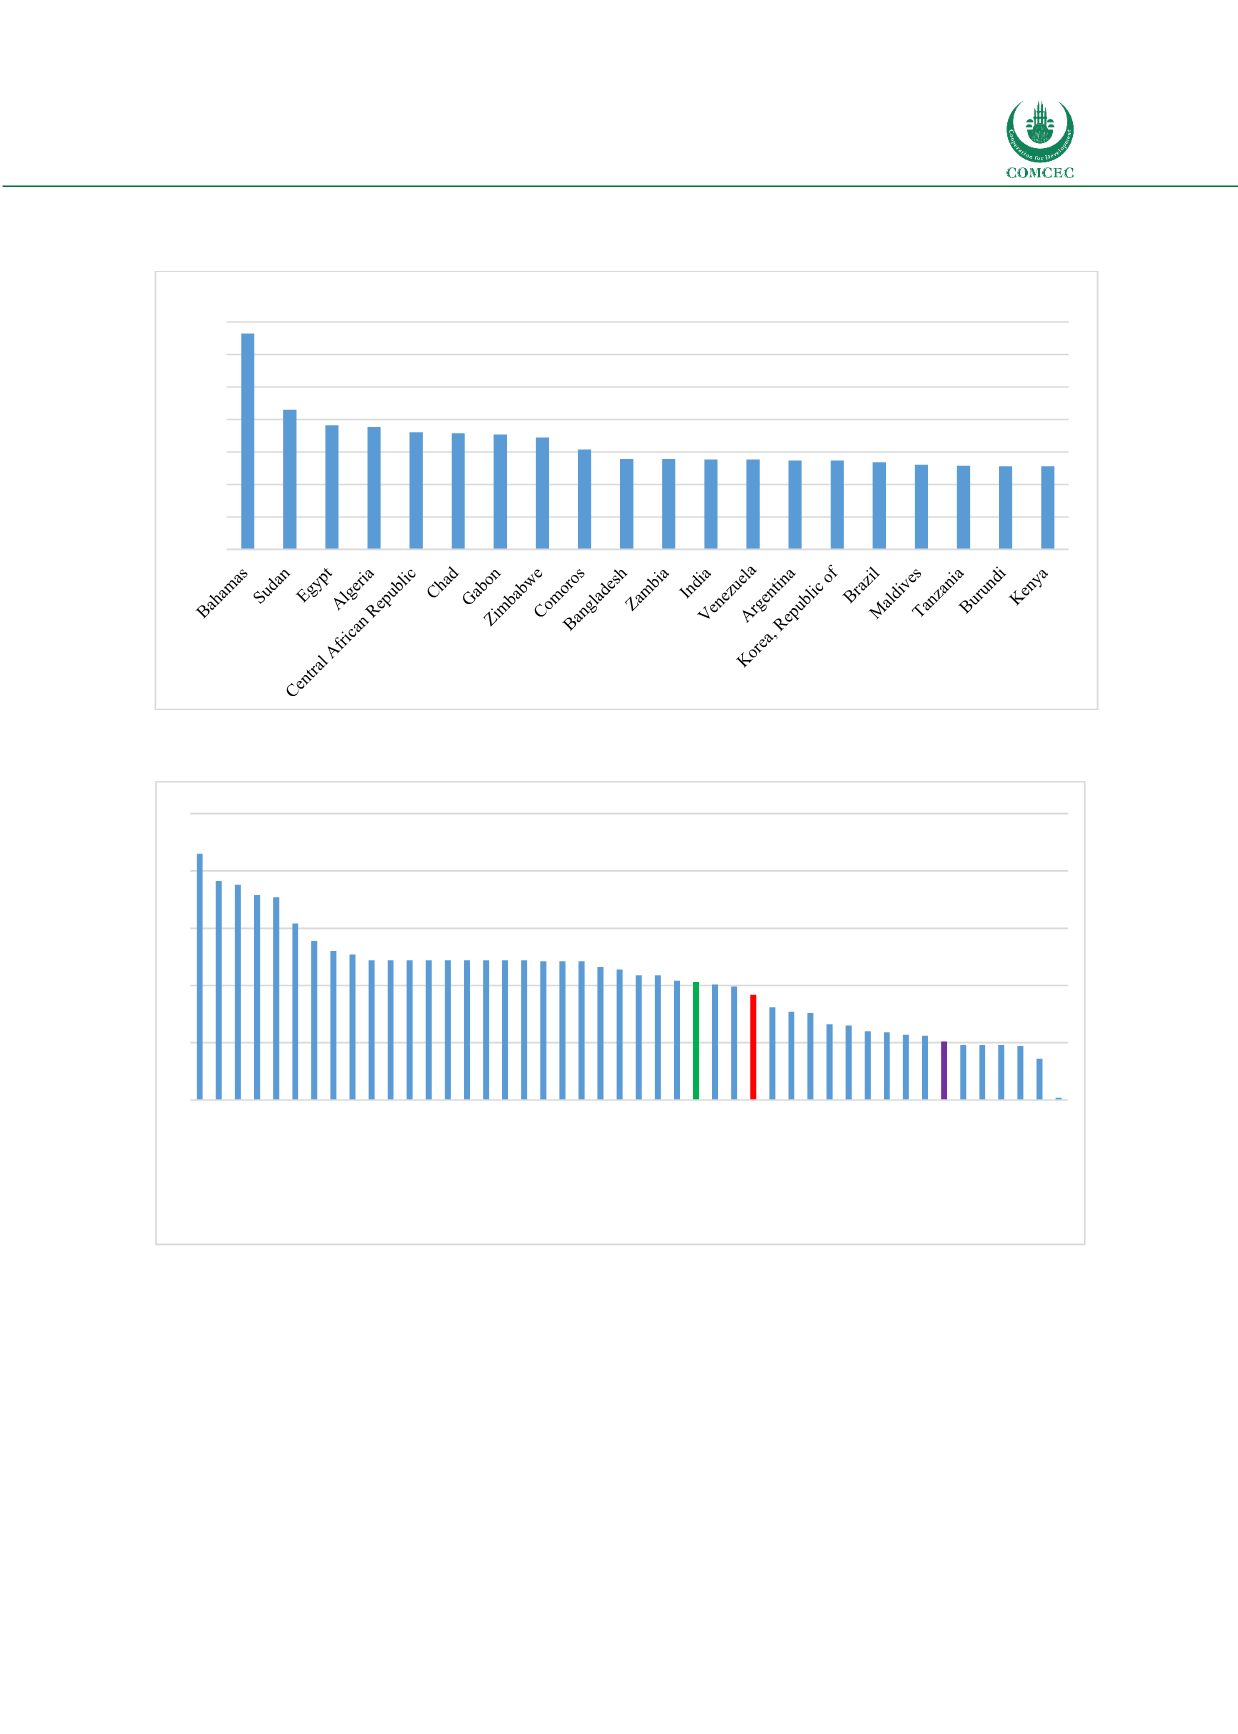
Figure 45: The 20 Highest Simple Average Applied MFN Tariffs among the WTO Members
(2017)
Source: WTO Tariff Profiles 2018 database
Figure 46: Simple Average Applied MFN Tariffs in the OIC Countries (2017)
Source: WTO Tariff Profiles 2018 database
Agriculture sector is one of the crucial sectors for many countries in the world. In this regard,
countries apply higher tariffs on agricultural products than on the manufactured products.
Figure 47 and 48 below show the simple average applied MFN Tariffs on the agricultural and
non-agricultural products in the OIC Countries. OIC countries apply higher tariffs to agricultural
products. Countries that have inadequate agricultural production and need agricultural imports
apply lower tariffs on agricultural imports. On the other hand, the countries in which
agricultural production constitute a significant part of the economy apply higher tariffs to
agricultural imports.
0
5
10
15
20
25
30
35
Per cent
0
5
10
15
20
25
Sudan
Egypt
Algeria
Chad
Gabon
Comoros
Bangladesh
Maldives
Uganda
Benin
Burkina Faso
Côte d'Ivoire
Guinea-Bissau
Mali
Niger
Senegal
The Gambia
Togo
Guinea
Nigeria
Pakistan
Tunisia
Morocco
Guyana
Turkey
Suriname
OIC Average
Mozambique
Jordan
World Average
Indonesia
Tajikistan
Yemen
Kyrgyz Republic
Kazakhstan
Lebanon
Saudi Arabia
Malaysia
Oman
European Union
Bahrain
Qatar
UAE
Kuwait
Albania
Brunei Darussalam