


 14 / 101

COMCEC Agriculture Outlook 2016
3
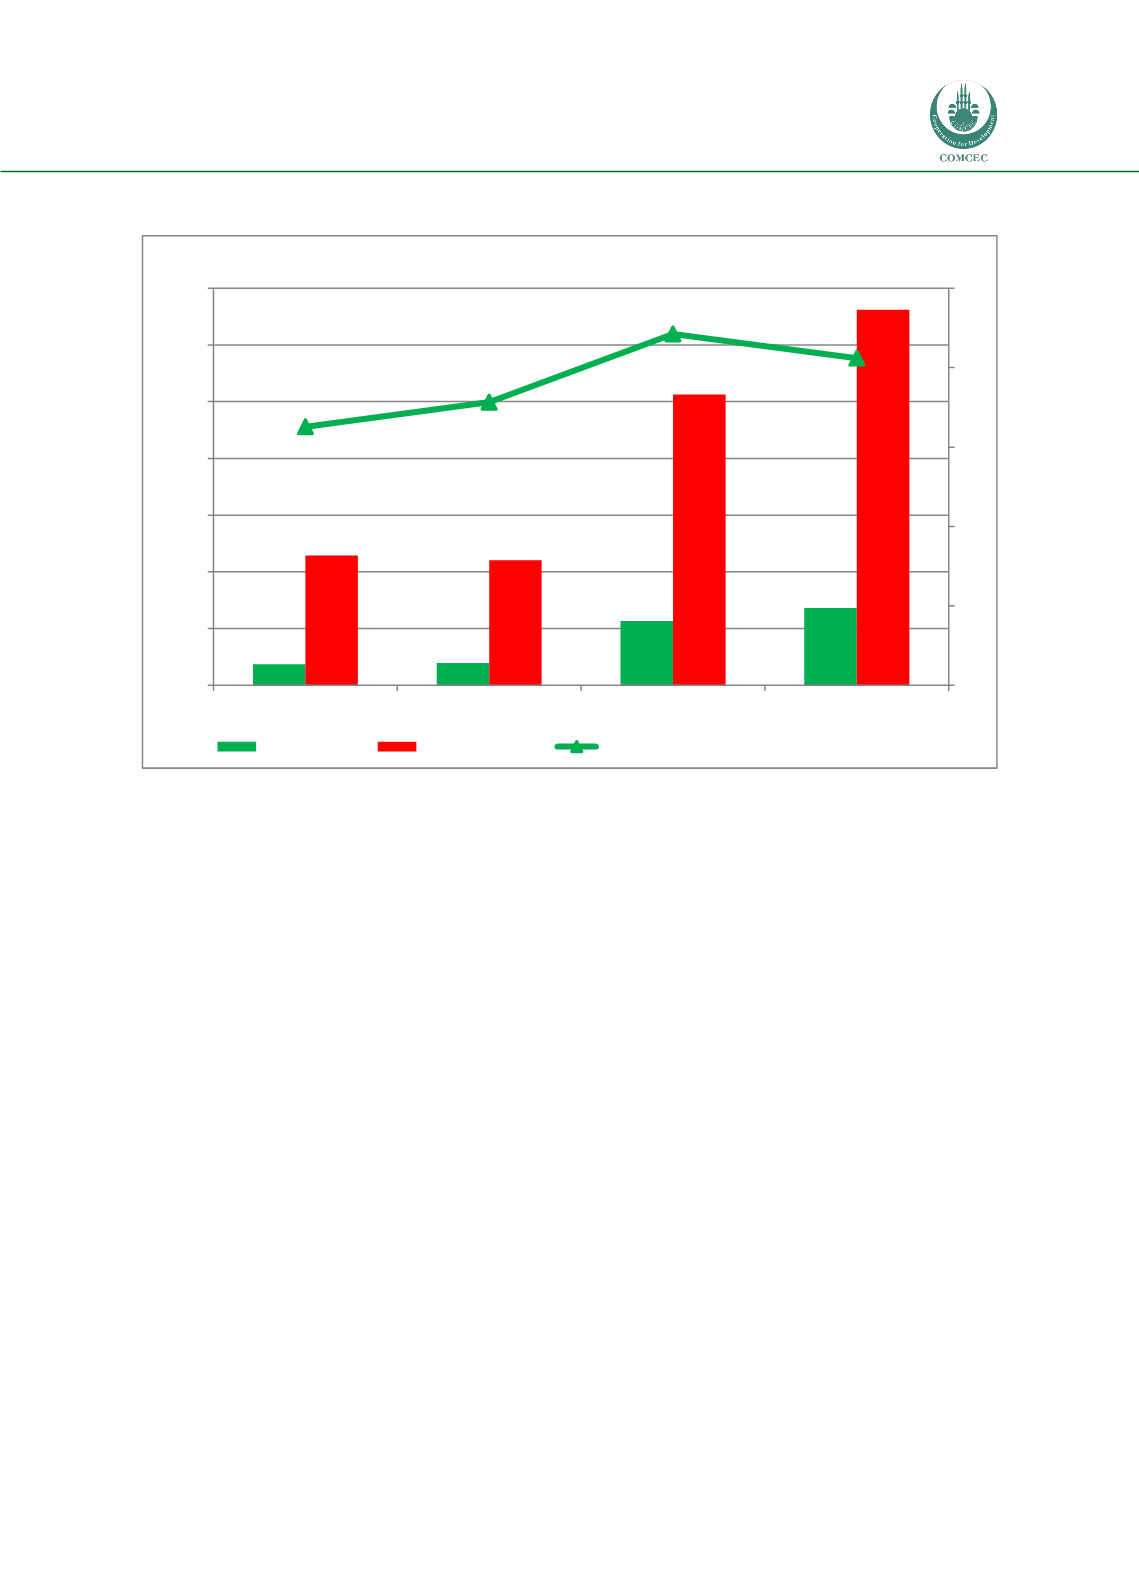
Figure 1. OIC Agricultural GDP and its Share in the World
Source: Calculated by using UNSTAT
The value of agricultural production in the OIC Member Countries rises in the last
decades due to increases in production as well as higher prices. Figure 1 shows the agriculture
sector contribution to GDP and its share in the world’s agricultural production. In 1990, OIC
agricultural GDP was 186 billion US Dollars with a share of 16 percent in the world’s
agricultural production. In 2014, OIC agricultural GDP reached to 682 billion US Dollars with a
share of 21 percent in the world’s agricultural production. This figure is important because it
shows the increasing trend of OIC agricultural production in the world agricultural production.
Nonetheless, according to FAO, OIC Member Countries have 29 percent of total world
agricultural area. From this data, it is clear that OIC Member Countries have a relatively lower
performance in agriculture sector. Therefore, the potential of agricultural sector in OIC
Member Countries should be appropriately utilized to increase the share of OIC agricultural
production in the world.
16 %
18 %
22 %
21 %
0
5
10
15
20
25
0
500
1.000
1.500
2.000
2.500
3.000
3.500
1990
2000
2010
2014
Percent
Billion Dollar
OIC Total
World Total
Share of OIC Agricultural GDP in the World