
Malnutrition in the OIC Member
Countries: A Trap for Poverty
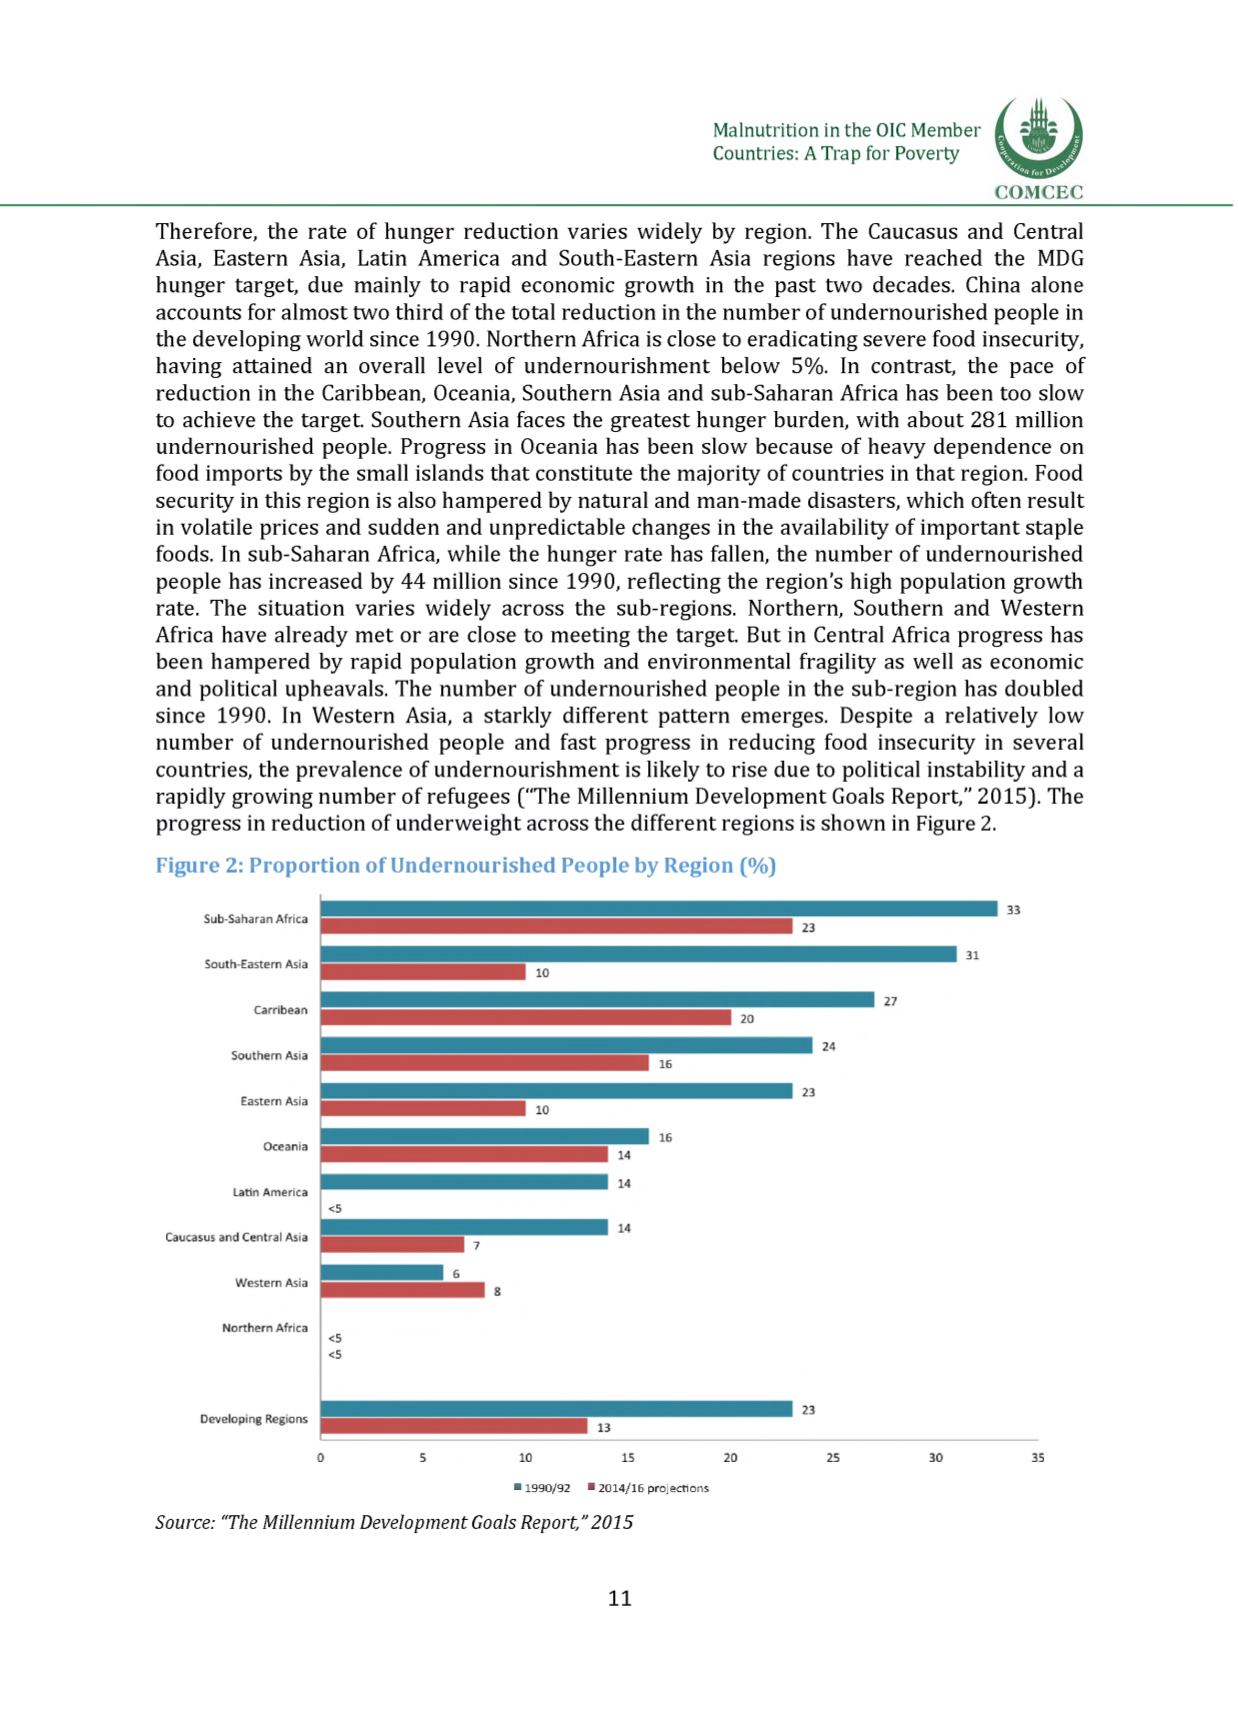
Therefore, the rate of hunger reduction varies widely by region. The Caucasus and Central
Asia, Eastern Asia, Latin America and South-Eastern Asia regions have reached the MDG
hunger target, due mainly to rapid economic growth in the past two decades. China alone
accounts for almost two third of the total reduction in the number of undernourished people in
the developing world since 1990. Northern Africa is close to eradicating severe food insecurity,
having attained an overall level of undernourishment below 5%. In contrast, the pace of
reduction in the Caribbean, Oceania, Southern Asia and sub-Saharan Africa has been too slow
to achieve the target. Southern Asia faces the greatest hunger burden, with about 281 million
undernourished people. Progress in Oceania has been slow because of heavy dependence on
food imports by the small islands that constitute the majority of countries in that region. Food
security in this region is also hampered by natural and man-made disasters, which often result
in volatile prices and sudden and unpredictable changes in the availability of important staple
foods. In sub-Saharan Africa, while the hunger rate has fallen, the number of undernourished
people has increased by 44 million since 1990, reflecting the region's high population growth
rate. The situation varies widely across the sub-regions. Northern, Southern and Western
Africa have already met or are close to meeting the target. But in Central Africa progress has
been hampered by rapid population growth and environmental fragility as well as economic
and political upheavals. The number of undernourished people in the sub-region has doubled
since 1990. In Western Asia, a starkly different pattern emerges. Despite a relatively low
number of undernourished people and fast progress in reducing food insecurity in several
countries, the prevalence of undernourishment is likely to rise due to political instability and a
rapidly growing number of refugees (“The Millennium Development Goals Report,” 2015]. The
progress in reduction of underweight across the different regions is shown i
n Figure 2.Figure 2: Proportion of Undernourished People by Region (%)
■ 1990/92 ■ 2014/16 projections
Source: "The Millennium Development Goals Report,"2015
11


