
Malnutrition in the OIC Member
Countries: ATrap for Poverty
COMCEC__________________________________________________________________________________________
alike and showed the immense value of setting ambitious goals. Yet, despite remarkable gains,
inequalities persisted and progress has been uneven, with over 60% of the world's poor living
in just five countries (MDG 2015 report). To date, while unprecedented progress has been
made in terms of poverty eradication and human development, many of the targets, including
MDG-1C (to halve the proportion of people who suffer from hunger), are far from being
achieved (Korenromp, 2015).
MDG-1C brought attention to the need to improve food and nutrition security. It was
comprised of two indicators for monitoring progress: the prevalence of underweight children
under five years of age and the proportion of the population below the minimum level of
dietary energy consumption. The nutritional status of children was recognized as a key
indicator of poverty and hunger which was an important step in acknowledging that national
policies and programmes which improve nutrition have a role to play in development beyond
the resolution of individual nutrient deficiencies (Webb, 2014).
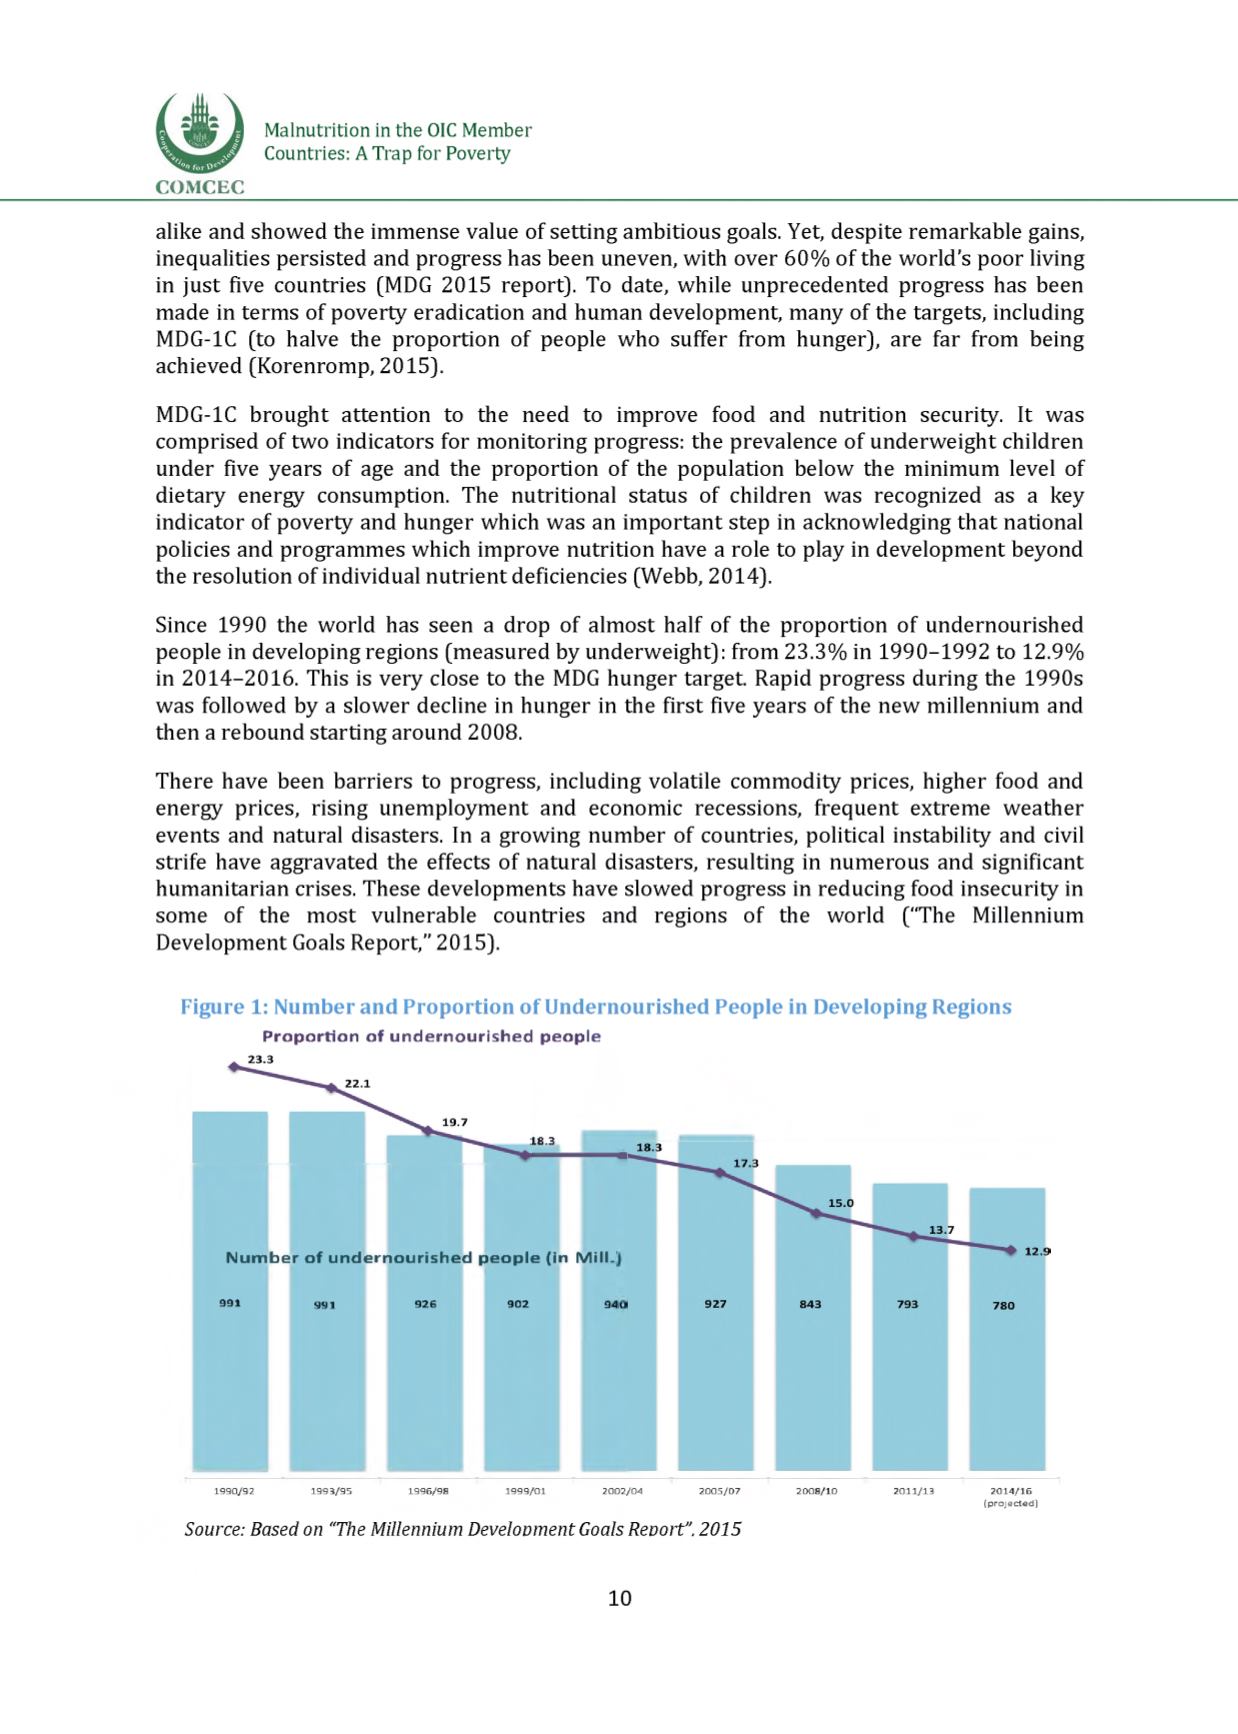
Since 1990 the world has seen a drop of almost half of the proportion of undernourished
people in developing regions (measured by underweight): from 23.3% in 1990-1992 to 12.9%
in 2014-2016. This is very close to the MDG hunger target. Rapid progress during the 1990s
was followed by a slower decline in hunger in the first five years of the new millennium and
then a rebound starting around 2008.
There have been barriers to progress, including volatile commodity prices, higher food and
energy prices, rising unemployment and economic recessions, frequent extreme weather
events and natural disasters. In a growing number of countries, political instability and civil
strife have aggravated the effects of natural disasters, resulting in numerous and significant
humanitarian crises. These developments have slowed progress in reducing food insecurity in
some of the most vulnerable countries and regions of the world (“The Millennium
Development Goals Report,” 2015].
Figure 1: Number and Proportion of Undernourished People in Developing Regions
Proportion of und erno u rish ed people
18.3
N um ber of u nd erno u rish ed p eop le (in M ill/
991
991
926
902
94
1990/92
1993/95
1996/98
1999/01
2002/04
2005/07
2008/10
2011/13
2014/16
(projected)
Source: Based on "The Millennium Development Goals Report", 2015
10


