
Forced Migration in the OIC Member Countries:
Policy Framework Adopted by Host Countries
148
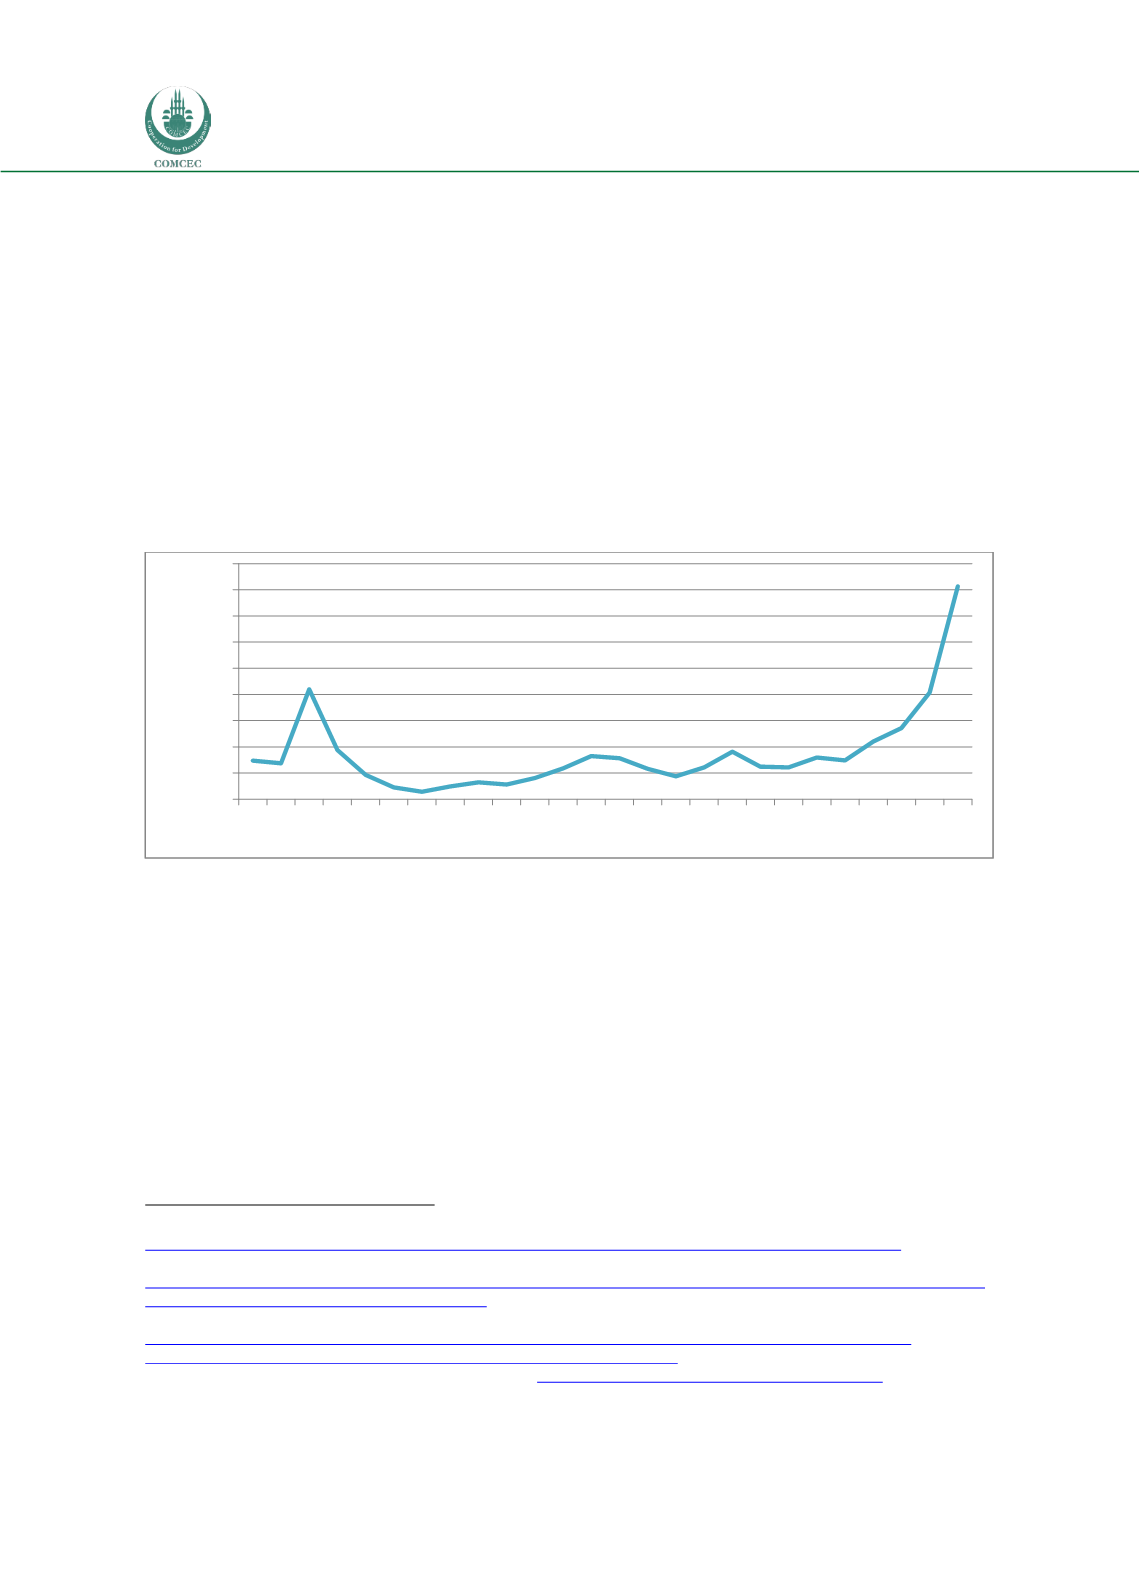
the partitioning of Serbia and Kosovo in the early 2000s, following an uptick in violence in
Iraq in 2007, and most recently after the Arab Spring and outbreak of civil war in Syria (Figure
19).
The number of applications for protection received in Sweden in 2015 was, however, by far
the highest on record. In total, authorities received nearly 163,000 applications for asylum
before the end of the year (equivalent to approximately 1.7 percent of Sweden's
population).
108
Most of the applications (114,000) came between September and December,
concentrating the demand for services and placing added strain on authorities. At the peak of
the flows in early November 2015, over 10,000 asylum seekers were arriving in Sweden per
week,
109
primarily via Denmark. As of the end of 2015, recognized refugees and asylum
seekers (those with outstanding asylum claims or with recognized protection status, but who
have not naturalized) comprised more than 3 percent of the Swedish population.
110
Figure 19: Asylum applications made in Sweden, by year, 1990-2015
Source: Eurostat, "Asylum applicants by citizenship till 2007 Annual data (rounded) [migr_asyctz]," updated May
8, 2015; Eurostat, " Asylum and first time asylum applicants by citizenship, age and sex Annual aggregated data
(rounded) [migr_asyappctza]," updated March 18, 2016
In addition to spontaneous asylum seekers, Sweden resettles nearly 2,000 refugees each year
from displacement situations around the world (selecting them in cooperation with
UNHCR).
111
Refugees are transported from their first countries of asylum to Sweden, where
they are given permanent residency.
National origins of asylum applicants
Whether they arrive through the asylum or resettlement systems, forced migrants in Sweden
are highly diverse in national origins, and the primary countries of origin for asylum seekers
shift, often substantially, from year to year. OIC countries have often made up a substantial
share of forced migrants seeking protection in Sweden; from 2011 to 2015, over 70 percent of
108
Migration Policy Institute, “Asylum Applications in the EU/EFTA by Country, 2008-2015,” accessed June 7, 2016,
http://www.migrationpolicy.org/programs/data-hub/charts/asylum-applications-euefta-country-2008-2015109
Migrationsverket, “Första gånger över 10 000 asylsökande de senaste sju dagarna,” updated November 9, 2015,
http://www.migrationsverket.se/Om-Migrationsverket/Nyhetsarkiv/Nyhetsarkiv-2015/2015-11-09-Forsta-ganger-over-10-000-asylsokande-de-senaste-sju-dagarna.html
110
MPI calculations from Statistics Sweden, “Population and Population Changes 1749-2015,“ updated February 22, 2016,
www.scb.se/en_/Finding-statistics/Statistics-by-subject-area/Population/Population-composition/Population- statistics/Aktuell-Pong/25795/Yearly-statistics--The-whole-country/26046/ ;UNHCR, “Population Statistics,” accessed August 5, 2016
, http://popstats.unhcr.org/en/persons_of_concern111
Eurostat, " Resettled persons by age, sex and citizenship Annual data (rounded) [migr_asyresa]," updated May 16, 2016,
http://ec.europa.eu/eurostat/web/products-datasets/-/migr_asyresa0
20.000
40.000
60.000
80.000
100.000
120.000
140.000
160.000
180.000
1990
1991
1992
1993
1994
1995
1996
1997
1998
1999
2000
2001
2002
2003
2004
2005
2006
2007
2008
2009
2010
2011
2012
2013
2014
2015


