
Forced Migration in the OIC Member Countries:
Policy Framework Adopted by Host Countries
131
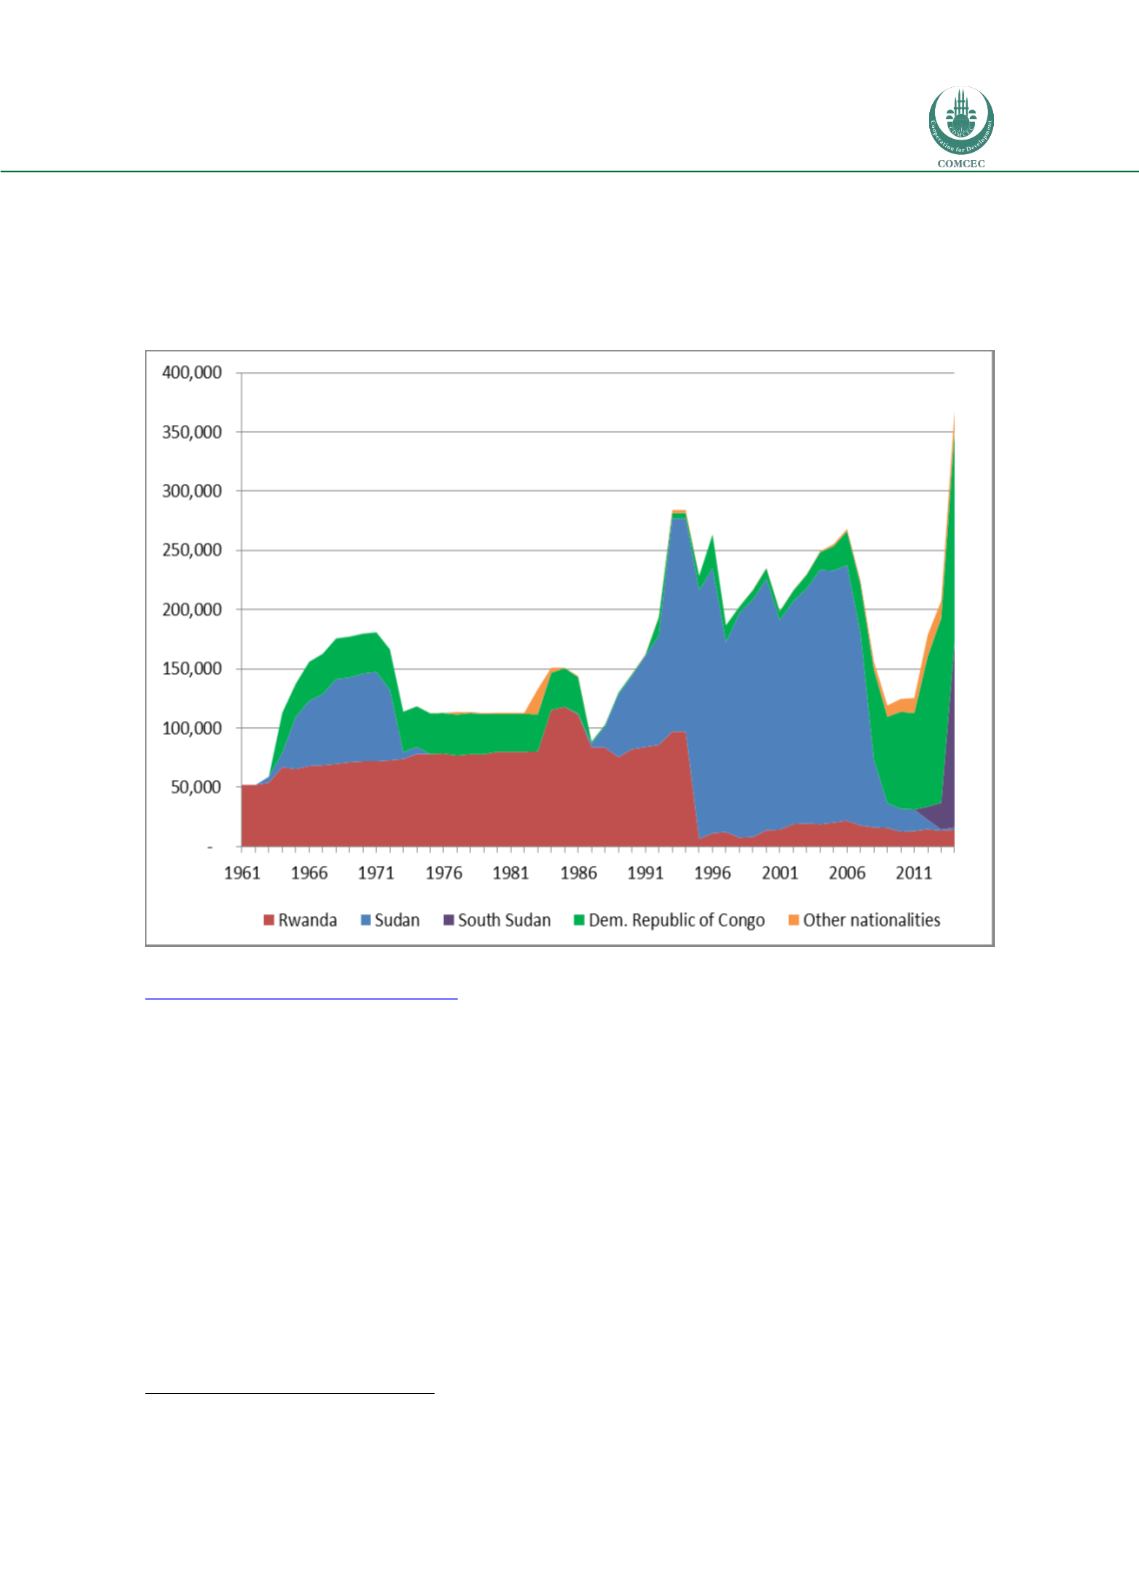
Figure 17 shows how the composition of refugee populations in Uganda has altered over time,
with Rwandan nationals comprising a significant share from the early 1960s to the mid-1990s,
and a substantial Sudanese refugee population displaced by the first and second Sudanese
civil wars (before then returning home), and now the ongoing conflict in South Sudan.
Figure 17: Refugees in Uganda, by country of origin and year
Source:
UNHCR,
“Population
Statistics:
Time
Series,”
accessed
May
16,
2016,
http://popstats.unhcr.org/en/time_series .Note: This covers refugees, including those in refugee-like situations. South Sudan gained independence from
Sudan in July 2011.
Together, women and children comprise 79 percent of all refugees in Uganda. More than half
of the refugees currently living in Uganda are children, and more than a third of the refugee
population are ages 11 or younger.
12
This age distribution, and the share of women and
children, varies among refugee groups, as illustrated in Figure 18. For example, two thirds of
South Sudanese refugees and asylum seekers are children, compared with one quarter of
Eritrean refugees and asylum seekers; and 15 percent of South Sudanese refugees and asylum
seekers are adult men, compared to nearly 40 percent of Eritrean refugees and asylum
seekers.
12
OPM, “Uganda – Monthly Refugee Statistics Update [31st May 2016].”


