


 122 / 148

Child and Maternal Mortality
in Islamic Countries
111
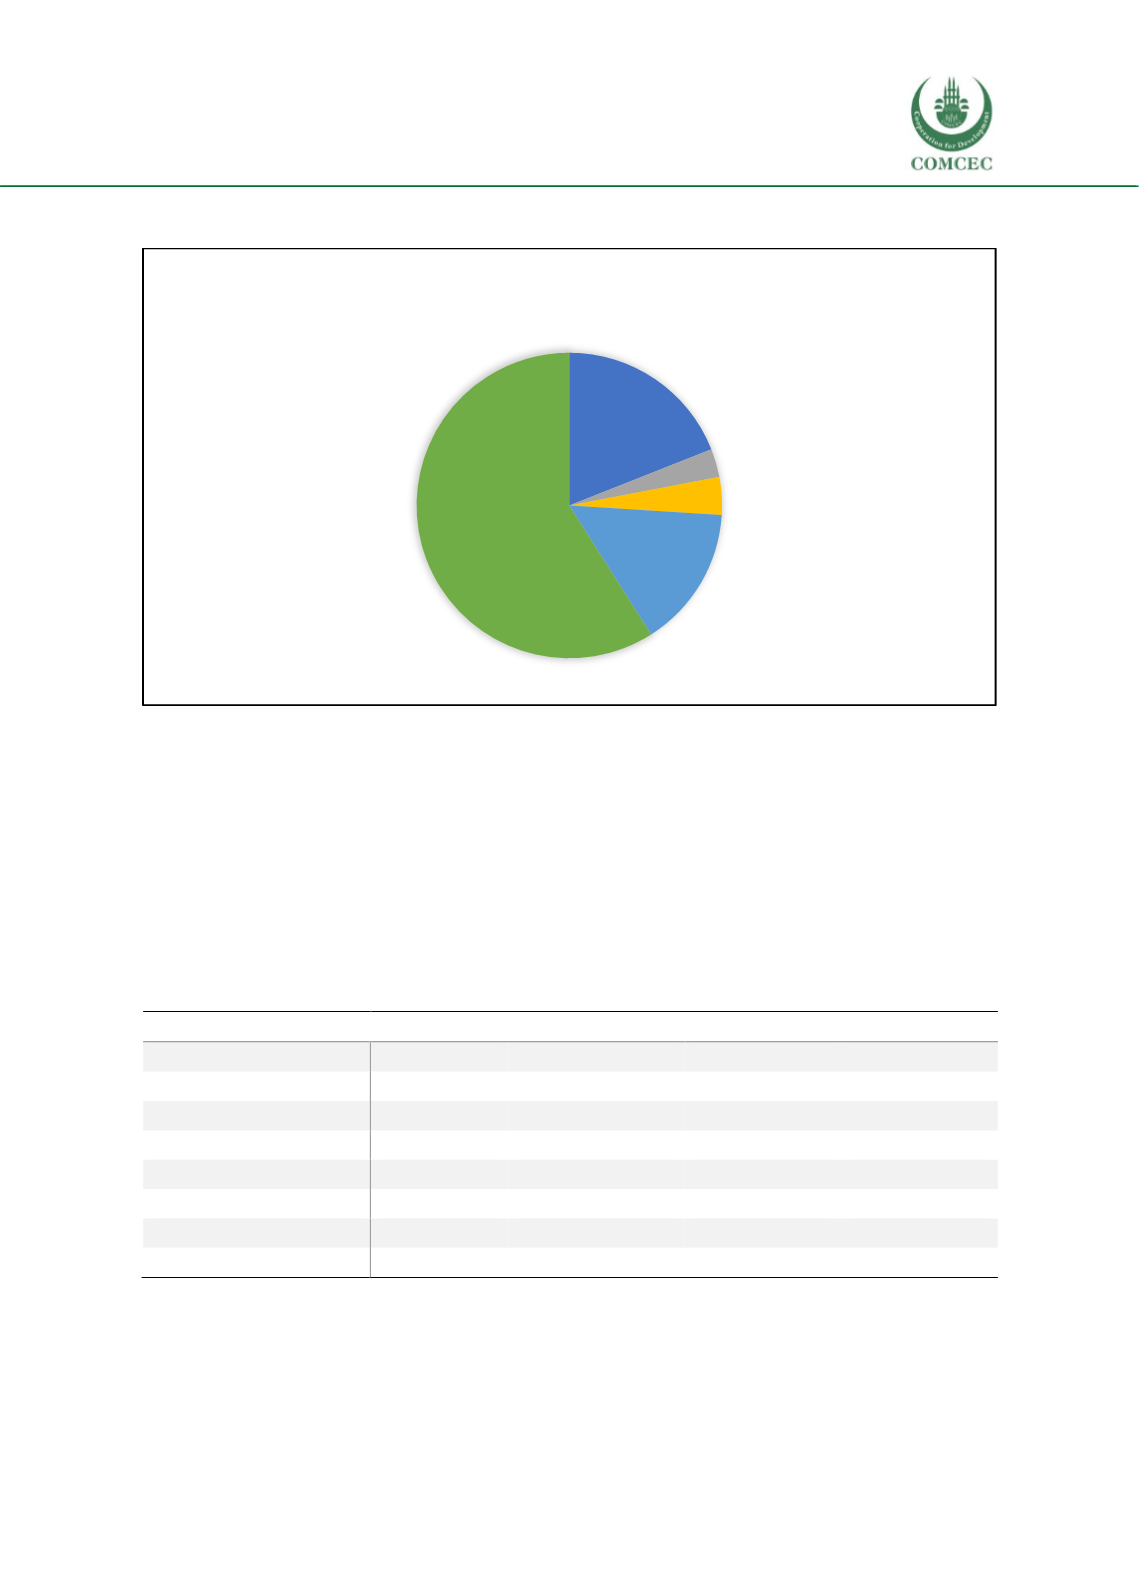
Figure 3.58. Donors’ contributions to the Reproductive, Maternal, Neonatal and Child Health
Health Expenditure: COTE D’IVOIRE
Table 3.3 shows an increase in government expenditure (GGHED%CHE) from 2000 to 2016 in
Cote d'Ivoire. However, the GDP data show that the economic growth of the country was stalled
between 2000 and 2010, but started to increase slightly. The share of OOPS has decreased from
59% to 40% of the current health expenditure, while the government expenditure (GGE) has
only slightly increased during 2000-2010. The out-of-pocket spending has decreased since 2010
steadily, which coincides with another tumultuous election year in the country. Yearly trends
in health expenditure in Cote d’Ivoire are shown in Figure 3.59 and 3.60.
Table 3. 3 Key figures of current health expenditure indicators in Cote d’Ivoire
YEAR
2000
2005
2010
2016
GDP PER CAPITA US$
1,321
1,202
1,205
1,534
CHE PER CAPITA US$
75
64
74
68
GGHED%CHE
14%
14%
13%
26%
GGHED%GDP
0.8%
0.7%
0.8%
1.1%
OOPS%CHE
59%
60%
58%
40%
GGE%GDP
18%
19%
20%
23%
POPULATION
16,686,561
18,336,304
20,401,332
23,695,920
Source: WHO Global Health Expenditure Database.
KfW
19%
Initiavie 5% MEAE
0%
UNICEF
3%
C2D
4%
OMS
15%
UNFPA Koica,
Muskoka
59%
Reproductive, Maternal, Neonatal and Child Health ($32,727,273)