


 51 / 108

44
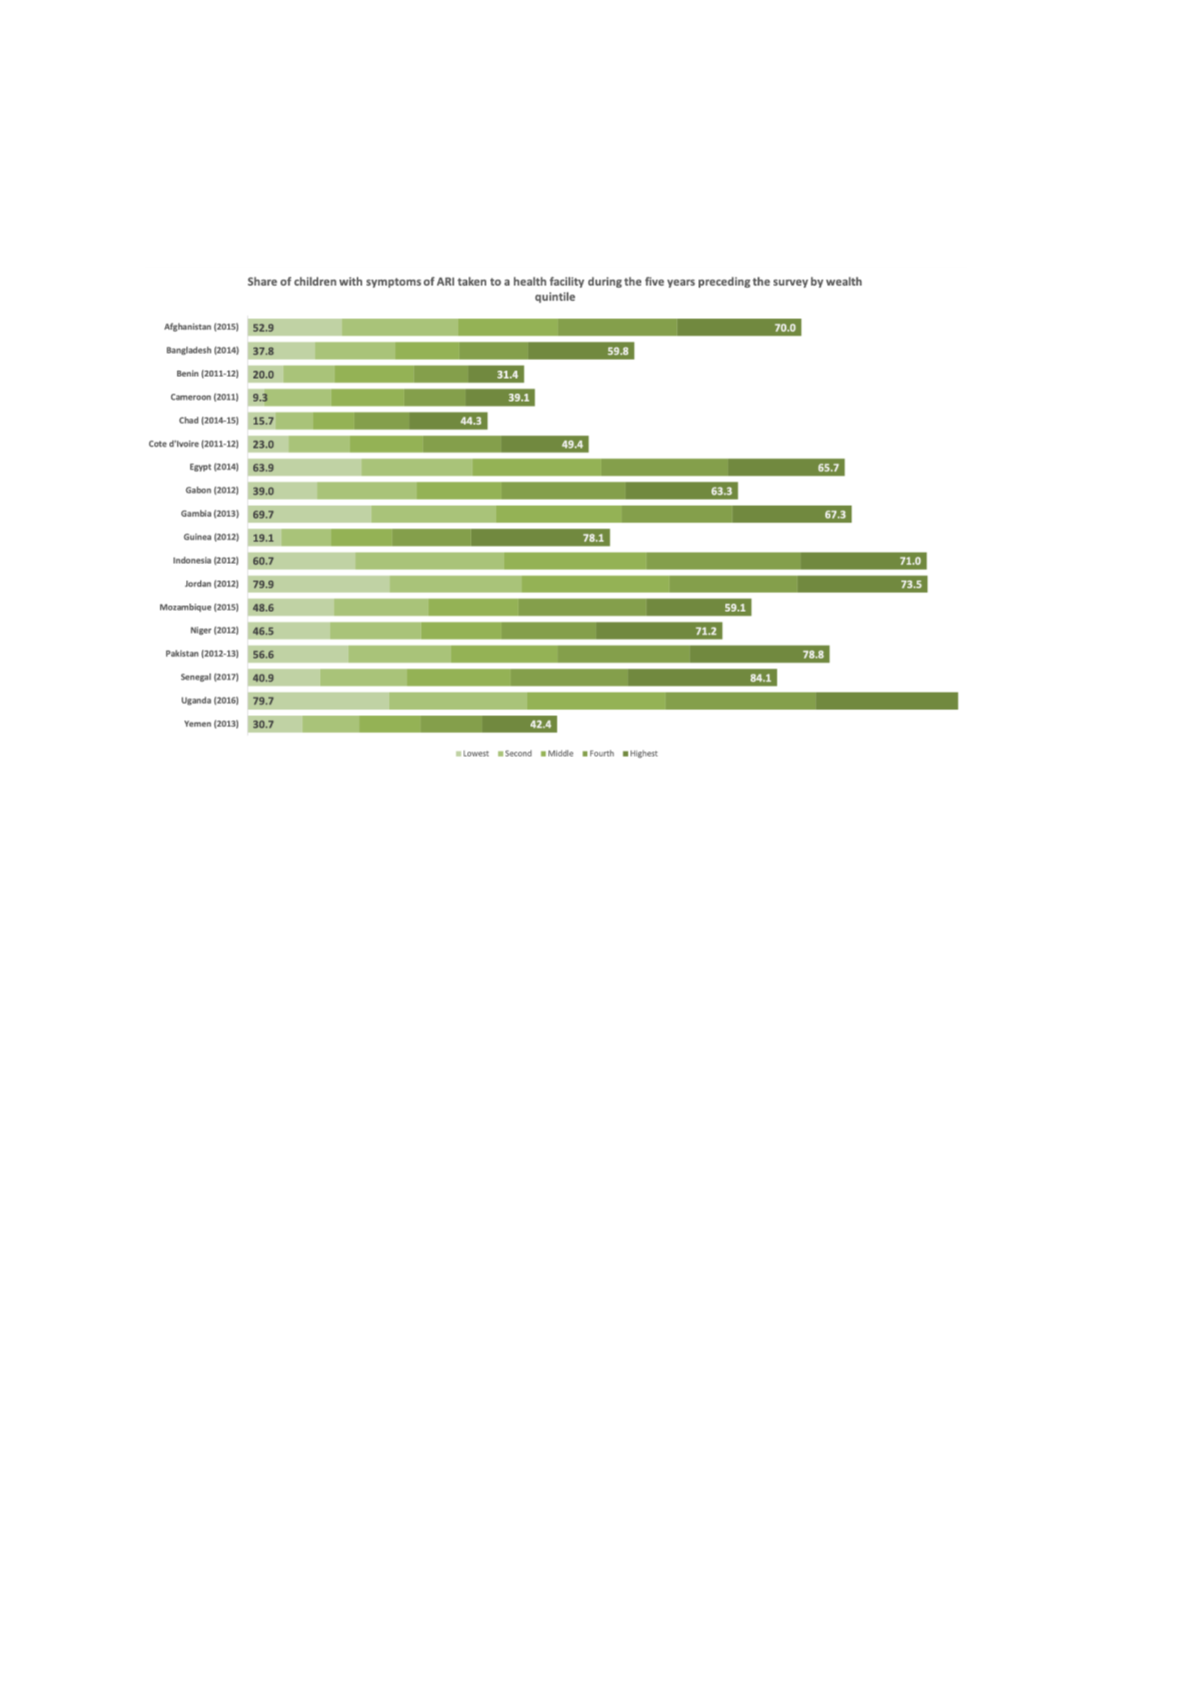
Figure 25: Share of children with symptoms of ARI taken to a health facility during the 5 years
preceding the survey, by wealth quintile since 2010
ICF, 2015. The DHS Program STATcompiler. Funded by USAID.
http://www.statcompiler.com. January 31 2019
Financial accessibility
Figure 26and
Figure 27below gives an overview on different levels of access to health insurance by
women and men in different OIC countries, where data was available. Having access to health
insurance greatly increases access as it reduces out-of-pocket expenditures which pose a major barrier
to access – especially for the poor. Similarly as to what we observed with access indicators above
(Figure 23an
d Figure 24), and even though sometimes large differences exist between poor and rich
population groups, the poor are more likely to have access in countries where larger parts of rich
population groups have health insurance. It is striking to see in how few countries larger parts of the
population are insured, indicating the long way to go to enhance financial access to health in many OIC
countries.
Risk factors
A large pool of wealth disaggregated data available relates to two major risk factors to health. Below
i
n Figure 28 an
d Figure 29we show the share of the population living in households using an improved
water source and of the share of the population living in households with improved, non-shared toilet
facilities as an indicator for reduced risk to health for 35 and 33 countries, respectively.
The figures reveal stark differences in infrastructure access within and between countries. It is
encouraging to see that the access to safe drinking water has improved generally for many parts of the
population – however, there are still very large differences between the poorest and richer population
groups. Furthermore, the observation on the indicators above – that higher levels of access for richer
groups makes higher levels of access for poorer generally more likely – does not seem to be true in this
case. Whereas in almost all countries i
n Figure 28the richest quintile has almost universal access to
safe drinking water (the smallest level of coverage is 83.0 per cent), access to safe water by the poorest
populations differ widely between 24.4 per cent in Mauritania and 25.5 per cent in Kazakhstan to 95.3
per cent in Egypt and 96.7 per cent in Jordan.