
221
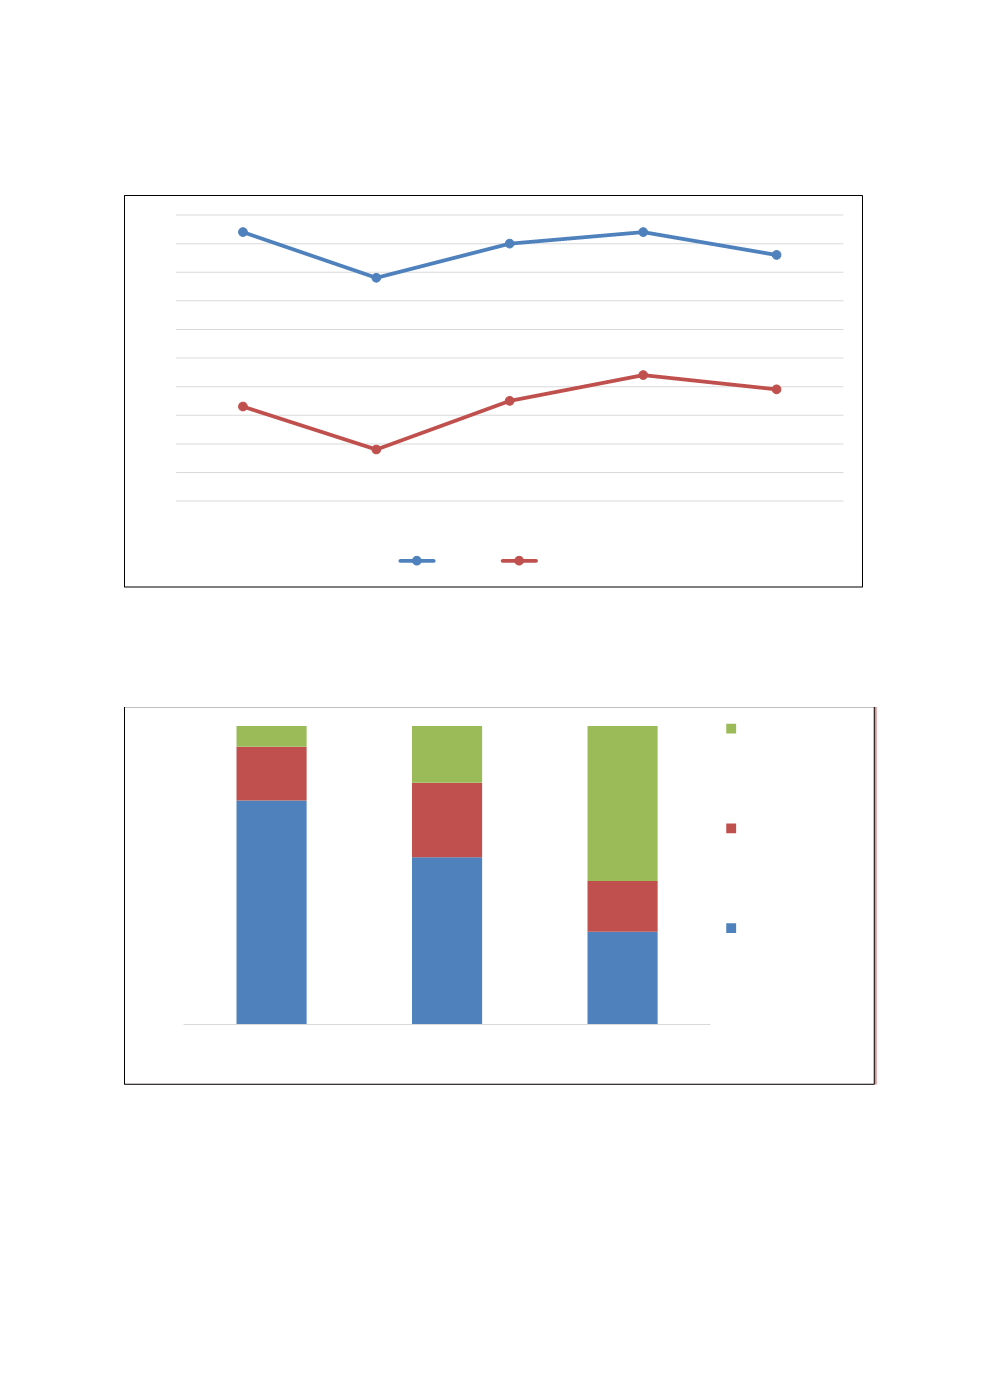
Appendix Figure 7
: National Urban-Rural Achievement Gap Trend in SPM, 2012-2016
Source
: Annual Report 2016, Malaysia Education Blueprint 2013-2025, MOE
Appendix Figure 8
: Distribution of student population receiving KWAPM by school band
5,44
5,28
5,4
5,44
5,36
4,83
4,68
4,85
4,94
4,89
4,5
4,6
4,7
4,8
4,9
5
5,1
5,2
5,3
5,4
5,5
2012
2013
2014
2015
2016
Rural
Urban
75
56
31
18
25
17
7
19
52
0
10
20
30
40
50
60
70
80
90
100
Good Schools,
Band 1 & 2
Average Schools,
Band 3, 4, 5
Poor Schools,
Band 6 & 7
Schools with >
2/3 students
receiving
KWAPM
Schools with
1/3 - 2/3
students
receiving
KWAPM
Schools with
<1/3 students
receiving
KWAPM


