


 230 / 253

218
ANNEXES
Malaysia
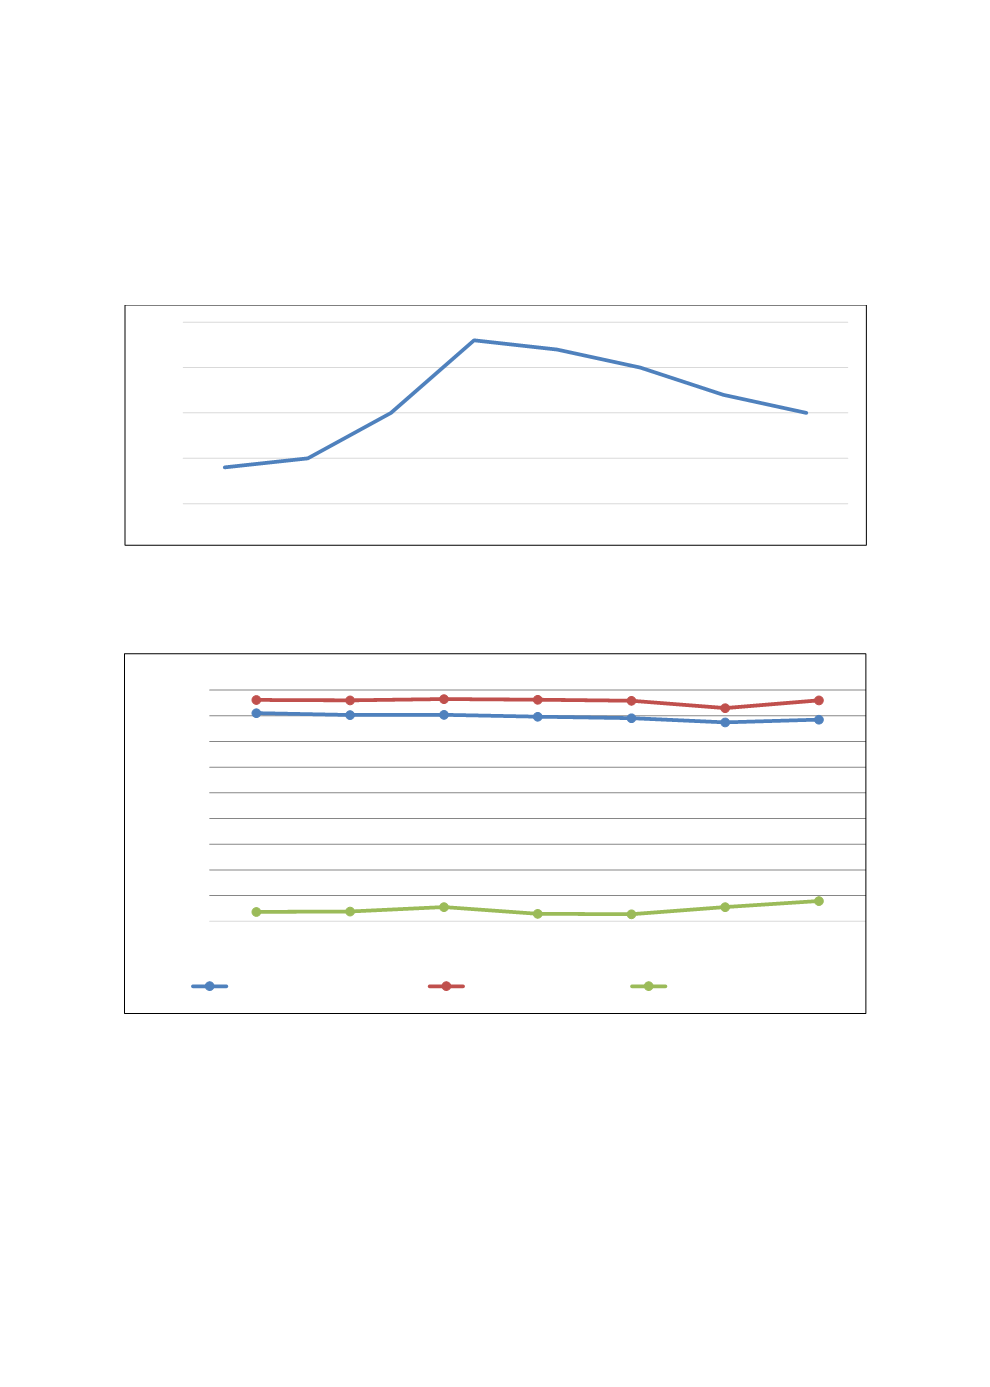
Appendix Figure 1
: Public spending on education as a share of gross domestic product
Source
: World Data Atlas
Appendix Figure 2
: Transition rates in Government and Government-Aided Schools inMalaysia
(2010-2016)
Source
: Malaysian Educational Statistics, MOE 2014; 2015; 2016
4,0
4,5
5,0
5,5
6,0
1995
2006
2010
2011
2012
2013
2014
2015
10
20
30
40
50
60
70
80
90
100
2010 2011 2012 2013 2014 2015 2016
Transition Rate (%)
Standard 6 - Form 1
Form 3 -Form 4
Form 5 -Form 6