


 178 / 253

166
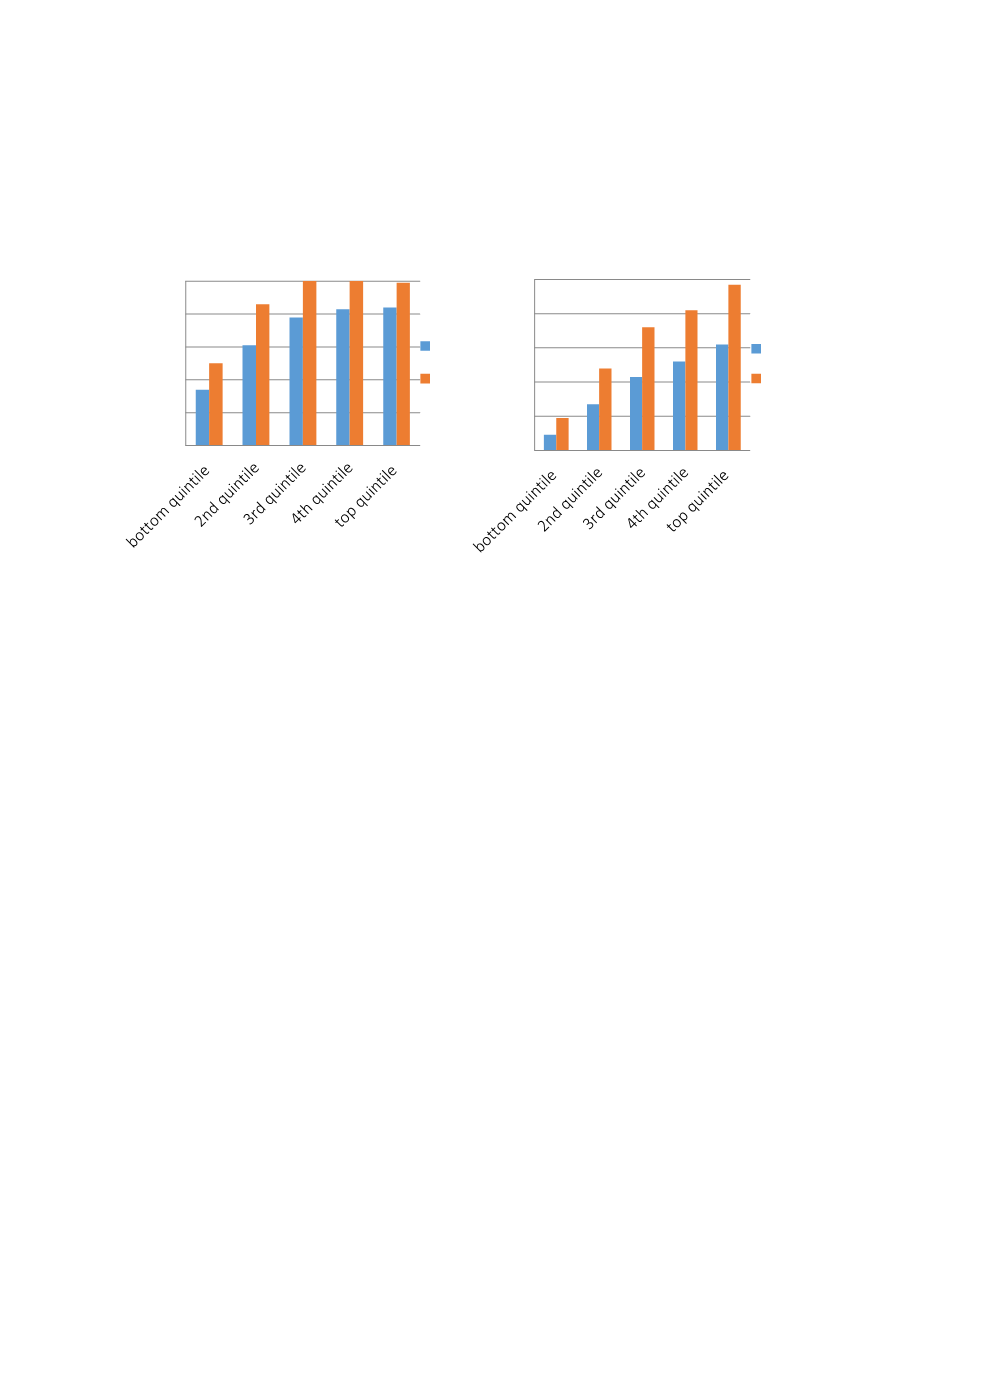
Figure 3.4.1: Gross and Net Attendance in Primary and Secondary School by Household
Wealth, 2011
Source:
Author; data from NPC & RTI (2016)
Poverty remains a major factor hindering educational access, despite the effort by the
government to provide free and compulsory education. The Nigerian Human Development
Report by UNDP (2015: 32) notes that 57% of females and 48% of males were “afraid of not
being able to pay their children’s or own education”. The report also lists inability to bear
personal or children’s educational expenses fees as one of the greatest concerns people held
in relation to threats to individual security. Evidence suggests that majority of the country's
13.2 million out-of-school children possibly belong to the lowest quintile: while the estimated
number of out-of-school children stood around 10.4 million in 2014, the street children
(particularly Almajiri – see section 2.9) constituted about 9.5million. MICS' household survey
data shows that economic reasons (monetary cost and labour needs of the households) ranked
very high among other factors that hinder enrolment and completion. In 2015, the monetary
cost of education and labour needs of the family respectively ranked 21% and 18% (totalling
39%) and were among top reasons people never attended school in Nigeria (NPC &RTI, 2016).
It is noteworthy that up to 10% had no interest in formal education. Qualitative reasons for this
were not provided. Besides poverty and economic pressures on poorer households, in the
literature, low quality and value of education, unemployment andmistrust of Western education
are noted as contributing factors that make education unattractive to some Nigerians, especially
in the northern parts of the country (Usman, 2006, 2008; Hoechner, 2013; Humphreys and
Crawfurd, 2014; Ezegwu et al, 2017).
Data from the National Bureau of Statistics (NBS, 2013), which accommodated both MICS and
Millennium Development Goals (MDG) indicators, shows that the aggregate adjusted NAR for
the country's children of primary school age attending primary or secondary school stood at
97.2 and 65.1 in urban and rural areas respectively. The NER for children of primary school age
attending primary or secondary school for the period of 2016/17 stood at 26.2% for the children
from poorest households, 90.5% for children in the richest households, 44.1 and 91.5 for those
whose mother had no education and higher education respectively. Igbo and Yoruba ethnic
groups respectively recorded over 85% respectively while Hausa had less than 50% (46.6)
(NBS, 2017). Across the geopolitical zones, the NBS (2013) shows that southern zones had a
0%
20%
40%
60%
80%
100%
Primary NAR and GAR by
Household Wealth
NAR
GAR
0%
20%
40%
60%
80%
100%
JSS NAR and GAR by
Household Wealth
NAR
GAR